HOT TOPICS LIST
- MACD
- Fibonacci
- RSI
- Gann
- ADXR
- Stochastics
- Volume
- Triangles
- Futures
- Cycles
- Volatility
- ZIGZAG
- MESA
- Retracement
- Aroon
INDICATORS LIST
LIST OF TOPICS
PRINT THIS ARTICLE
by Koos van der Merwe
A share price should always fall or rise to fill a gap. Should you buy or sell when that happens?
Position: Sell
Koos van der Merwe
Has been a technical analyst since 1969, and has worked as a futures and options trader with First Financial Futures in Johannesburg, South Africa.
PRINT THIS ARTICLE
GAPS
Yelp, Buy That Gap
02/18/14 04:04:36 PMby Koos van der Merwe
A share price should always fall or rise to fill a gap. Should you buy or sell when that happens?
Position: Sell
| When a share rises or falls on a gap, the theory is that the price should always move to fill that gap. Does this happen all the time? It does not, but the odds are that it will happen most of the time, so watching a share price after a gap has occurred is always a must. |

|
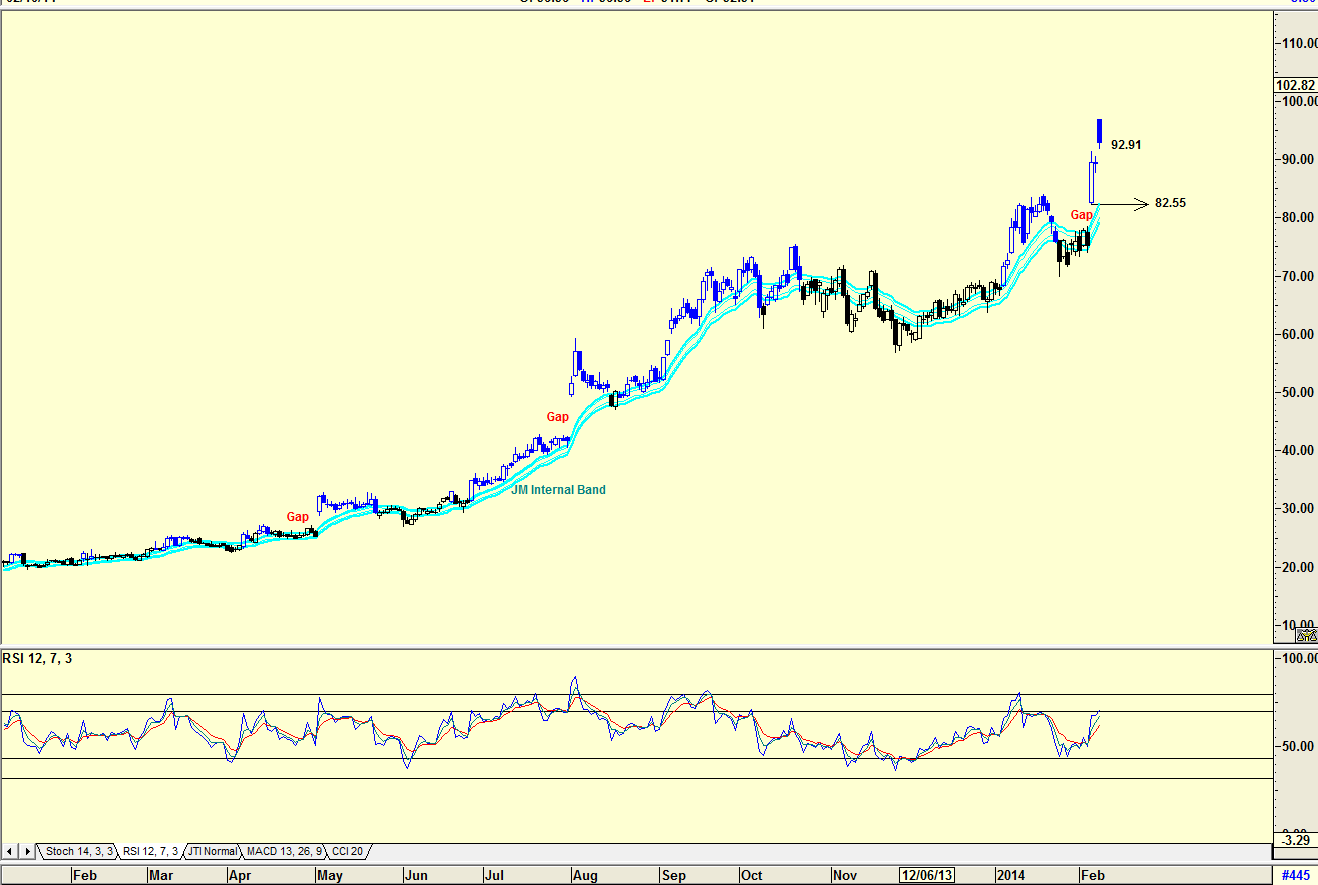
| Figure 1. Daily chart showing gaps. |
| Graphic provided by: AdvancedGET. |
| |
| The chart in Figure 1 is a daily chart of Yelp (YELP), showing three gaps. In two of them, the share price did fall to fill the gap, suggesting that the share price should fall from its present price of $92.91 as shown on the chart to somewhere below $82.55. Note how the RSI indicator is approaching overbought levels but has not yet given a sell signal. Fundamentally, positive news for YELP is that Yahoo is linking up with YELP, which could be very positive for the company. Therefore, buying on the dip, that is, when the share price drops to fill the gap, could be a good move. |

|
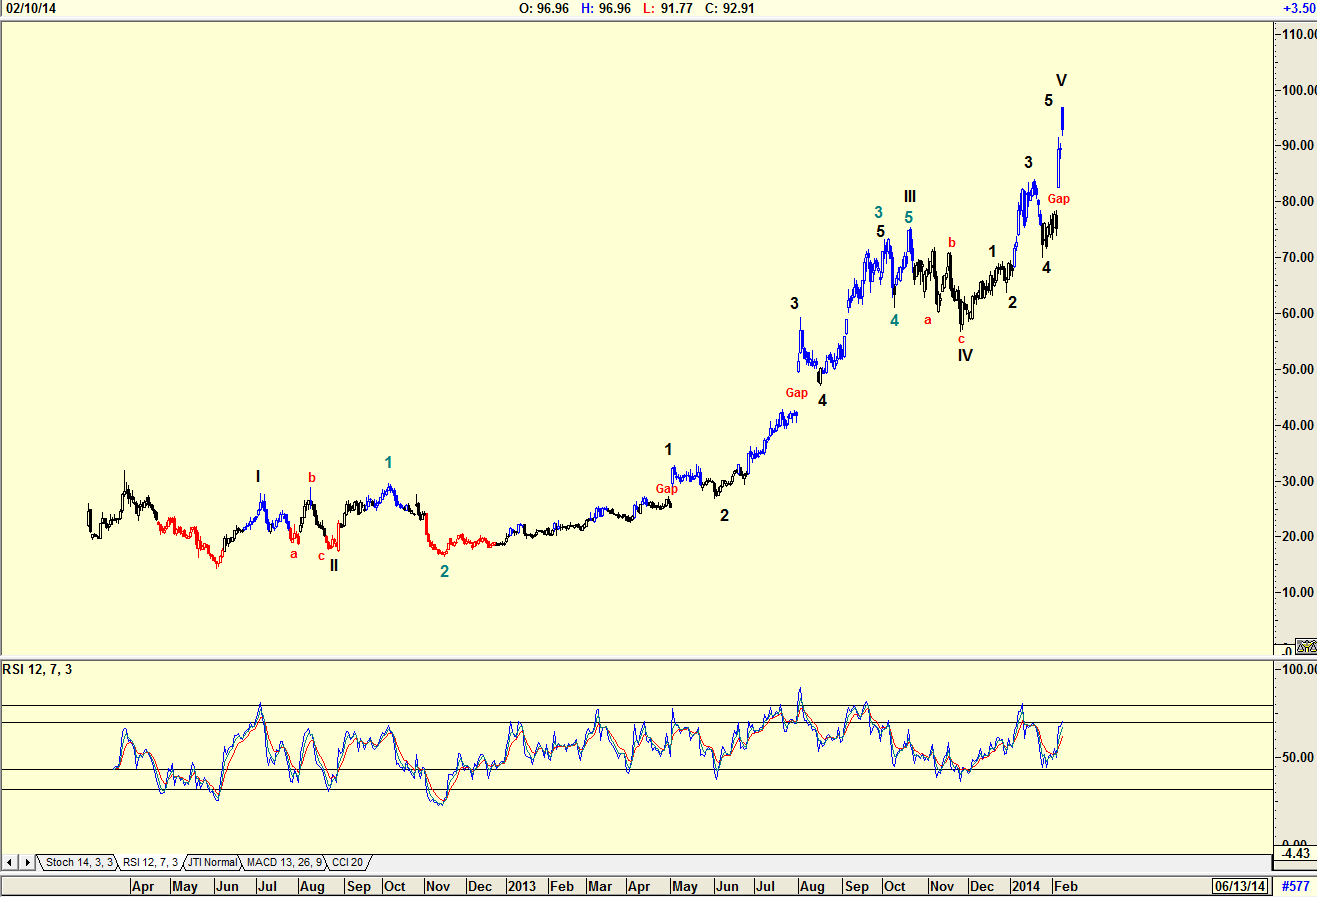
| Figure 2. Daily chart with Elliott Wave count. |
| Graphic provided by: AdvancedGET. |
| |
| The chart in Figure 2 is a daily chart with my preferred Elliott Wave count. The count is suggesting that a WAVE V is being completed, and that the price should now correct in an abc correction. I must say that I do like the company, and although I do not own it in spite of my positive article about the share on January 8, 2014, I shall place it on my watch list for a future buy. |
Has been a technical analyst since 1969, and has worked as a futures and options trader with First Financial Futures in Johannesburg, South Africa.
| Address: | 3256 West 24th Ave |
| Vancouver, BC | |
| Phone # for sales: | 6042634214 |
| E-mail address: | petroosp@gmail.com |
Click here for more information about our publications!
PRINT THIS ARTICLE

Request Information From Our Sponsors
- StockCharts.com, Inc.
- Candle Patterns
- Candlestick Charting Explained
- Intermarket Technical Analysis
- John Murphy on Chart Analysis
- John Murphy's Chart Pattern Recognition
- John Murphy's Market Message
- MurphyExplainsMarketAnalysis-Intermarket Analysis
- MurphyExplainsMarketAnalysis-Visual Analysis
- StockCharts.com
- Technical Analysis of the Financial Markets
- The Visual Investor
- VectorVest, Inc.
- Executive Premier Workshop
- One-Day Options Course
- OptionsPro
- Retirement Income Workshop
- Sure-Fire Trading Systems (VectorVest, Inc.)
- Trading as a Business Workshop
- VectorVest 7 EOD
- VectorVest 7 RealTime/IntraDay
- VectorVest AutoTester
- VectorVest Educational Services
- VectorVest OnLine
- VectorVest Options Analyzer
- VectorVest ProGraphics v6.0
- VectorVest ProTrader 7
- VectorVest RealTime Derby Tool
- VectorVest Simulator
- VectorVest Variator
- VectorVest Watchdog
