HOT TOPICS LIST
- MACD
- Fibonacci
- RSI
- Gann
- ADXR
- Stochastics
- Volume
- Triangles
- Futures
- Cycles
- Volatility
- ZIGZAG
- MESA
- Retracement
- Aroon
INDICATORS LIST
LIST OF TOPICS
PRINT THIS ARTICLE
by Koos van der Merwe
Of all the indicators I have played with, the RSI has been my favorite, yet I watch it carefully with the JM Internal Band indicator and the XTL indicator.
Position: Buy
Koos van der Merwe
Has been a technical analyst since 1969, and has worked as a futures and options trader with First Financial Futures in Johannesburg, South Africa.
PRINT THIS ARTICLE
REL. STR COMPARATIVE
Going Only With The RSI Indicator
02/10/14 05:06:47 PMby Koos van der Merwe
Of all the indicators I have played with, the RSI has been my favorite, yet I watch it carefully with the JM Internal Band indicator and the XTL indicator.
Position: Buy
| In all my years of trading, using Elliott Wave and Gann analysis, I have always found that I am inclined to look at the RSI indicator to get an idea of where exactly the stock is. Is it in an RSI overbought position, or oversold position? Yes, I have looked at stochastics, MACD, and many others using my Metastock program to add and build new indicators when they are published, often even building and playing with my own formulas, but I always seem to come back to the RSI indicator. There is, however, one negative I have found. As a buy signal, the RSI indicator is inclined to bring a buy to my attention occasionally in error. As a sell signal though, I have always found a trailing stop signal to be more effective. Two other indicators I watch are the JM Internal Band and the XTL indicator. So, having written all the above, with the stock market now in buy mode (see my previous article on the VIX) when I receive an RSI buy, I look at the share carefully. Citigroup (C) is one share that caught my attention. |

|
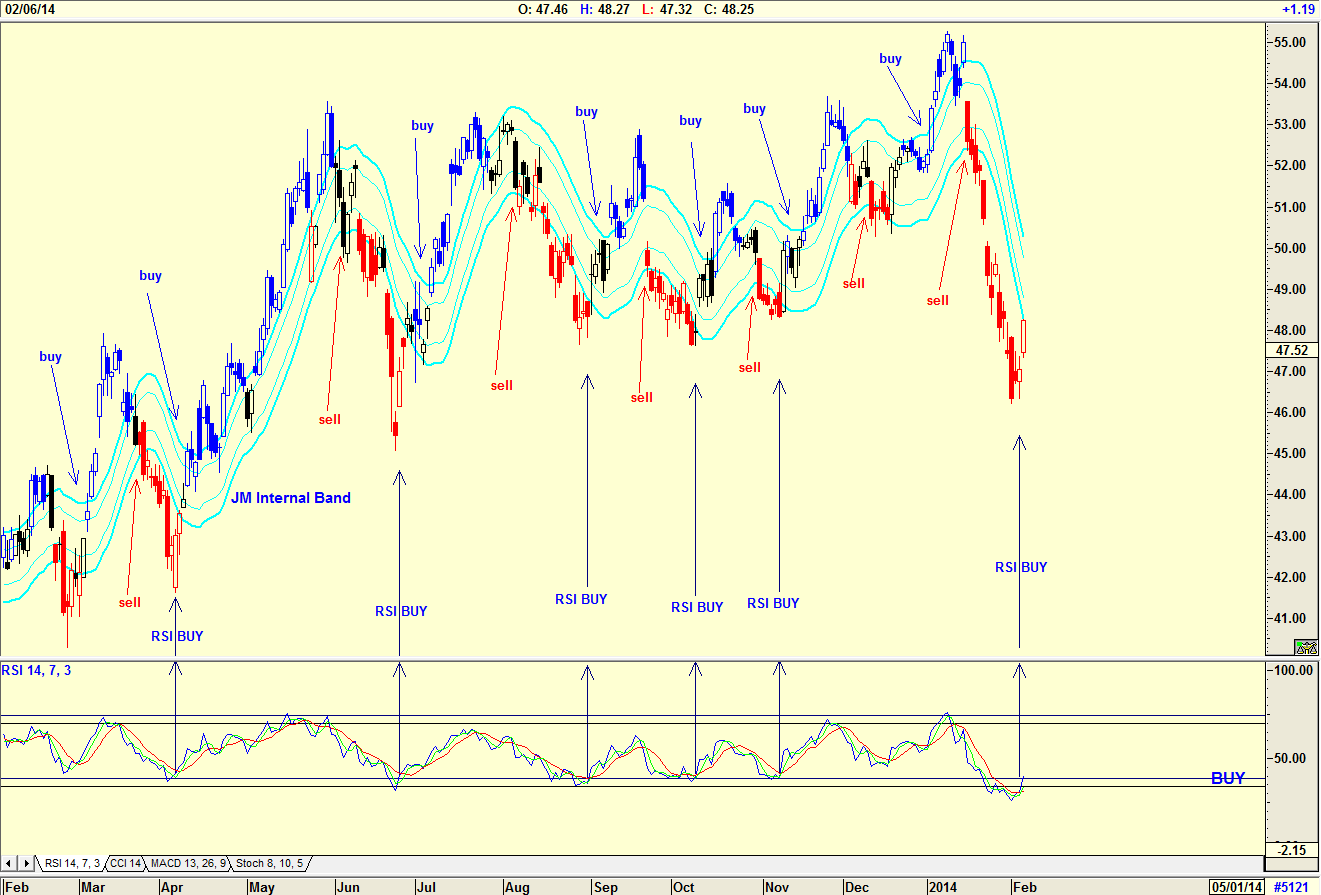
| Figure 1. Daily chart of Citigroup with RSI buy and sell signals. |
| Graphic provided by: AdvancedGET. |
| |
| The chart in Figure 1 is a daily chart of C giving me a buy signal as the RSI indicator crossed below and then re-crossed above the 32 level. The Advanced GET chart adds two moving averages to the RSI indicator, shown in green and red. I am inclined to buy when the RSI indicator crosses the five-period moving average (red) after it has fallen below the 32 horizontal. I would have then bought C at current prices. More cautious investors could still follow the JM Internal Band indicator, a 15-period simple moving average offset by 2% positive and 2% negative. |

|
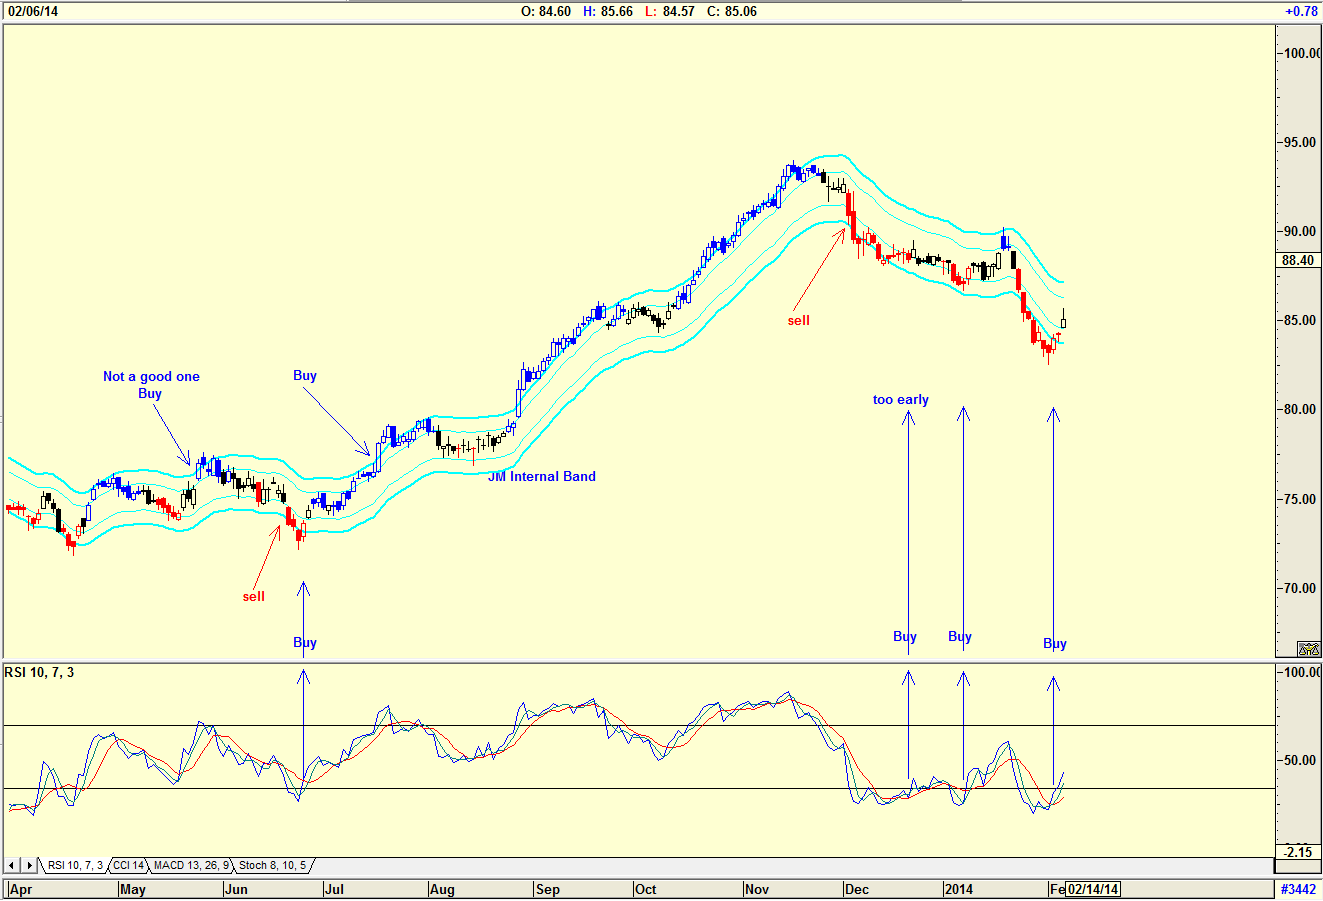
| Figure 2. Daily chart of National Bank of Canada showing RSI buy and sell signals. |
| Graphic provided by: AdvancedGET. |
| |
| The chart in Figure 2 is a daily chart of the National Bank of Canada. The chart shows the RSI buy signals, with one of them being too early. A stop loss would have taken you out of the position. Once again, note how the JM Internal Band indicator would have given a bad buy signal, followed by an exceptionally good signal. An RSI buy signal has been given, but a JM Internal Band buy signal has not been given. |

|
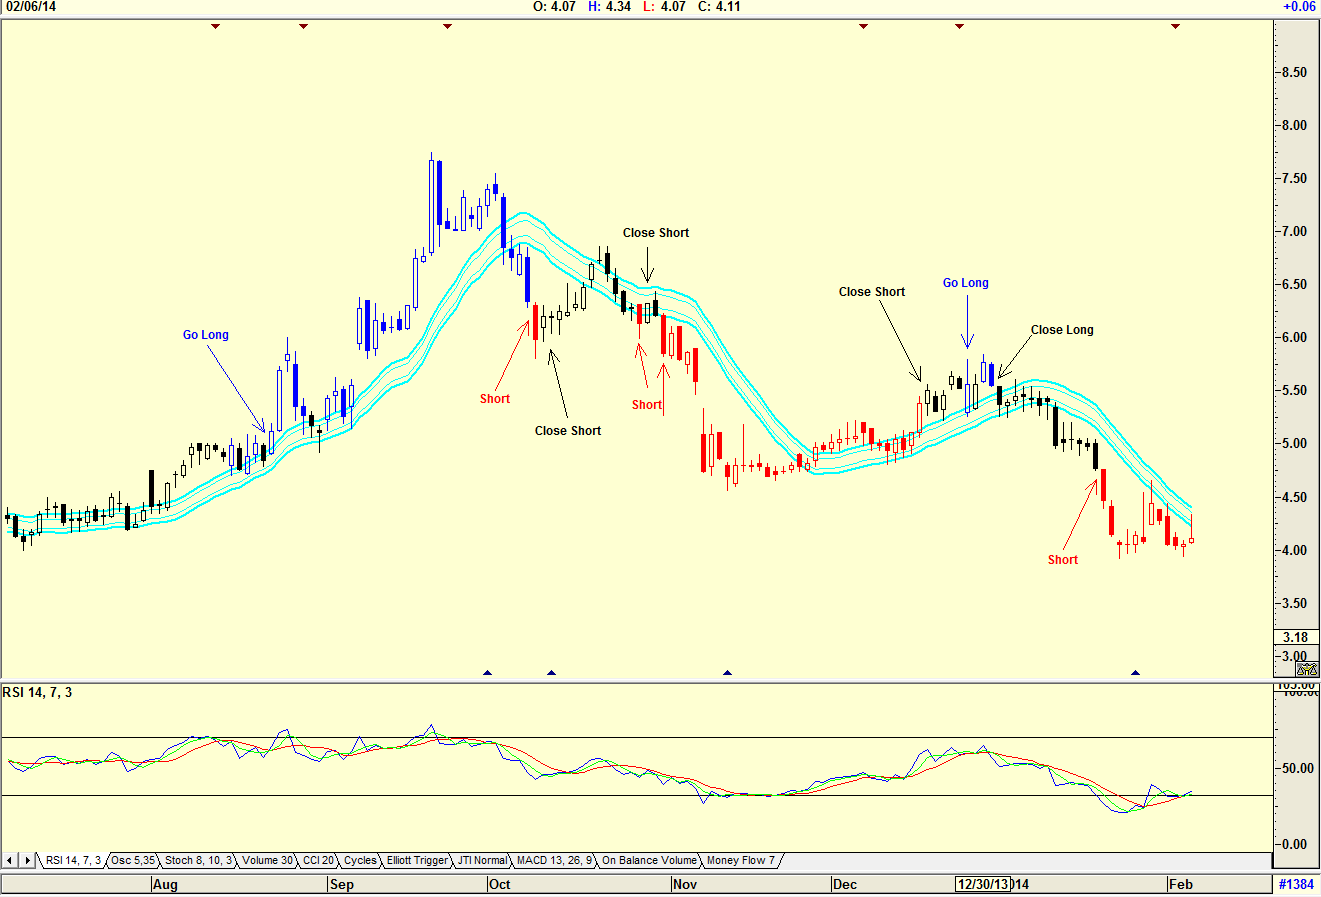
| Figure 3. Daily chart showing XTL buy and sell signals. |
| Graphic provided by: AdvancedGET. |
| |
| When you look at both charts you will see that the color of the candlesticks change from blue to black to red. This is the XTL indicator, and indicator offered by the Advanced GET program. The XTL (eXpert Trend Locator) parameter uses a statistical evaluation of the market that can tell the difference between random market swings (noise) and directed market swings (trends). When the candlesticks are blue, the indicator is suggesting a buy. When black, close your position and when red, short the stock. Is the strategy perfect? No, just a look at the chart in Figure 3 shows a number of not so wonderful signals, but the colors can act as a guide. Finding the perfect indicator to give buy or sell (short) signals has never been that easy. In the technological world of today, sophisticated computer algorithms are taking over the play. For an individual investor, a simple indicator like an RSI or any other preferred indicator that fits your personality is the probable answer. Not one will be perfect, however, but it will be a guide. |
Has been a technical analyst since 1969, and has worked as a futures and options trader with First Financial Futures in Johannesburg, South Africa.
| Address: | 3256 West 24th Ave |
| Vancouver, BC | |
| Phone # for sales: | 6042634214 |
| E-mail address: | petroosp@gmail.com |
Click here for more information about our publications!
Comments
Date: 02/12/14Rank: 4Comment: Could define the role of moving averages in more detail
Date: 02/13/14Rank: 4Comment:

Request Information From Our Sponsors
- VectorVest, Inc.
- Executive Premier Workshop
- One-Day Options Course
- OptionsPro
- Retirement Income Workshop
- Sure-Fire Trading Systems (VectorVest, Inc.)
- Trading as a Business Workshop
- VectorVest 7 EOD
- VectorVest 7 RealTime/IntraDay
- VectorVest AutoTester
- VectorVest Educational Services
- VectorVest OnLine
- VectorVest Options Analyzer
- VectorVest ProGraphics v6.0
- VectorVest ProTrader 7
- VectorVest RealTime Derby Tool
- VectorVest Simulator
- VectorVest Variator
- VectorVest Watchdog
- StockCharts.com, Inc.
- Candle Patterns
- Candlestick Charting Explained
- Intermarket Technical Analysis
- John Murphy on Chart Analysis
- John Murphy's Chart Pattern Recognition
- John Murphy's Market Message
- MurphyExplainsMarketAnalysis-Intermarket Analysis
- MurphyExplainsMarketAnalysis-Visual Analysis
- StockCharts.com
- Technical Analysis of the Financial Markets
- The Visual Investor
