HOT TOPICS LIST
- MACD
- Fibonacci
- RSI
- Gann
- ADXR
- Stochastics
- Volume
- Triangles
- Futures
- Cycles
- Volatility
- ZIGZAG
- MESA
- Retracement
- Aroon
INDICATORS LIST
LIST OF TOPICS
PRINT THIS ARTICLE
by Kevin Hopson
The AMEX Oil Index (XOI) gave a false buy signal last week when it broke a double top in the 460 to 465 range. Significant trendline resistance would have alerted traders to an upcoming reversal in the Index.
Position: Hold
Kevin Hopson
Kevin has been a technical analyst for roughly 10 years now. Previously, Kevin owned his own business and acted as a registered investment advisor, specializing in energy. He was also a freelance oil analyst for Orient Trading Co., a commodity futures trading firm in Japan. Kevin is currently a freelance writer.
PRINT THIS ARTICLE
CHART ANALYSIS
The AMEX Oil Index is Facing Significant Trendline Resistance
10/08/02 01:34:49 PMby Kevin Hopson
The AMEX Oil Index (XOI) gave a false buy signal last week when it broke a double top in the 460 to 465 range. Significant trendline resistance would have alerted traders to an upcoming reversal in the Index.
Position: Hold
| I touched on the AMEX Oil Index (XOI) last week. More specifically, I said that the XOI would likely find resistance in the 460 to 470 range - site of broken support, the Index's former uptrend line, a double top formation and its 50-day moving average. As expected, this came to fruition. However, some investors may have been suckered into a false buy signal. |
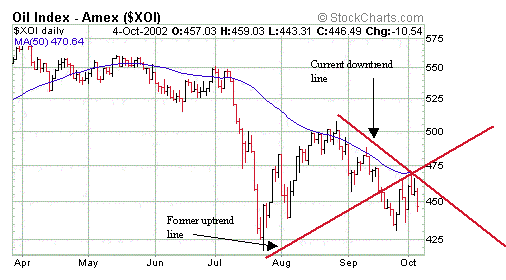
| For example, when the XOI broke a double top in the 460 to 465 range last week, the Index gave a short-term buy signal. However, if you were keeping an eye on the Index's converging trendlines, you would realize that the XOI was pushing up against significant resistance at the 470 level. To help clarify this, take a look at the daily chart on the XOI. |

|
| |
| Not only was the XOI facing stiff overhead along its former uptrend line and 50-day moving average, but the Index was also encountering resistance along its short-term downtrend line, which dates back to August's high. All three of these lines eventually crossed paths at the 470 level. As a result, it is no coincidence that the Index made an intraday high here last week and proceeded to reverse down. |
| Also, not seen on the chart is the XOI's long-term downtrend line, which dates back to May's high and is now converging around the 475 level. Being the case, the XOI has significant resistance to overcome in the 460 to 480 range if prices are going to move higher in the near-term. However, the Index - up to this point - seems content on following its downtrend line lower, meaning that a test of support in the 430-440 is possible this upcoming week. |
Kevin has been a technical analyst for roughly 10 years now. Previously, Kevin owned his own business and acted as a registered investment advisor, specializing in energy. He was also a freelance oil analyst for Orient Trading Co., a commodity futures trading firm in Japan. Kevin is currently a freelance writer.
| Glen Allen, VA | |
| E-mail address: | hopson_1@yahoo.com |
Click here for more information about our publications!
Comments

Request Information From Our Sponsors
- StockCharts.com, Inc.
- Candle Patterns
- Candlestick Charting Explained
- Intermarket Technical Analysis
- John Murphy on Chart Analysis
- John Murphy's Chart Pattern Recognition
- John Murphy's Market Message
- MurphyExplainsMarketAnalysis-Intermarket Analysis
- MurphyExplainsMarketAnalysis-Visual Analysis
- StockCharts.com
- Technical Analysis of the Financial Markets
- The Visual Investor
- VectorVest, Inc.
- Executive Premier Workshop
- One-Day Options Course
- OptionsPro
- Retirement Income Workshop
- Sure-Fire Trading Systems (VectorVest, Inc.)
- Trading as a Business Workshop
- VectorVest 7 EOD
- VectorVest 7 RealTime/IntraDay
- VectorVest AutoTester
- VectorVest Educational Services
- VectorVest OnLine
- VectorVest Options Analyzer
- VectorVest ProGraphics v6.0
- VectorVest ProTrader 7
- VectorVest RealTime Derby Tool
- VectorVest Simulator
- VectorVest Variator
- VectorVest Watchdog
