

HOT TOPICS LIST
- MACD
- Fibonacci
- RSI
- Gann
- ADXR
- Stochastics
- Volume
- Triangles
- Futures
- Cycles
- Volatility
- ZIGZAG
- MESA
- Retracement
- Aroon
INDICATORS LIST
LIST OF TOPICS
PRINT THIS ARTICLE
by Donald W. Pendergast, Jr.
Shares of IBM are down by 20% since March 2014 and are now near a major make or break point.
Position: N/A
Donald W. Pendergast, Jr.
Freelance financial markets writer and online publisher of the Trendzetterz.com S&P 500 Weekly Forecast service.
PRINT THIS ARTICLE
SUPPORT & RESISTANCE
IBM: Bullish On Daily, Bearish On Weekly?
02/12/14 03:14:47 PMby Donald W. Pendergast, Jr.
Shares of IBM are down by 20% since March 2014 and are now near a major make or break point.
Position: N/A
| The proportional retracement in shares of International Business Machines (IBM) over the past 11 months has been mild and orderly, especially on its weekly chart. Now in what could be the early stages of a consolidation pattern on the weekly time frame and a triple bottom pattern on its daily time frame, the stock may have what it needs to stage a modest rally on its daily chart even as a larger scale consolidation plays out on the weekly chart, prior to another move down to the next major weekly support level. Here's a closer look at both of these charts of IBM. |
|
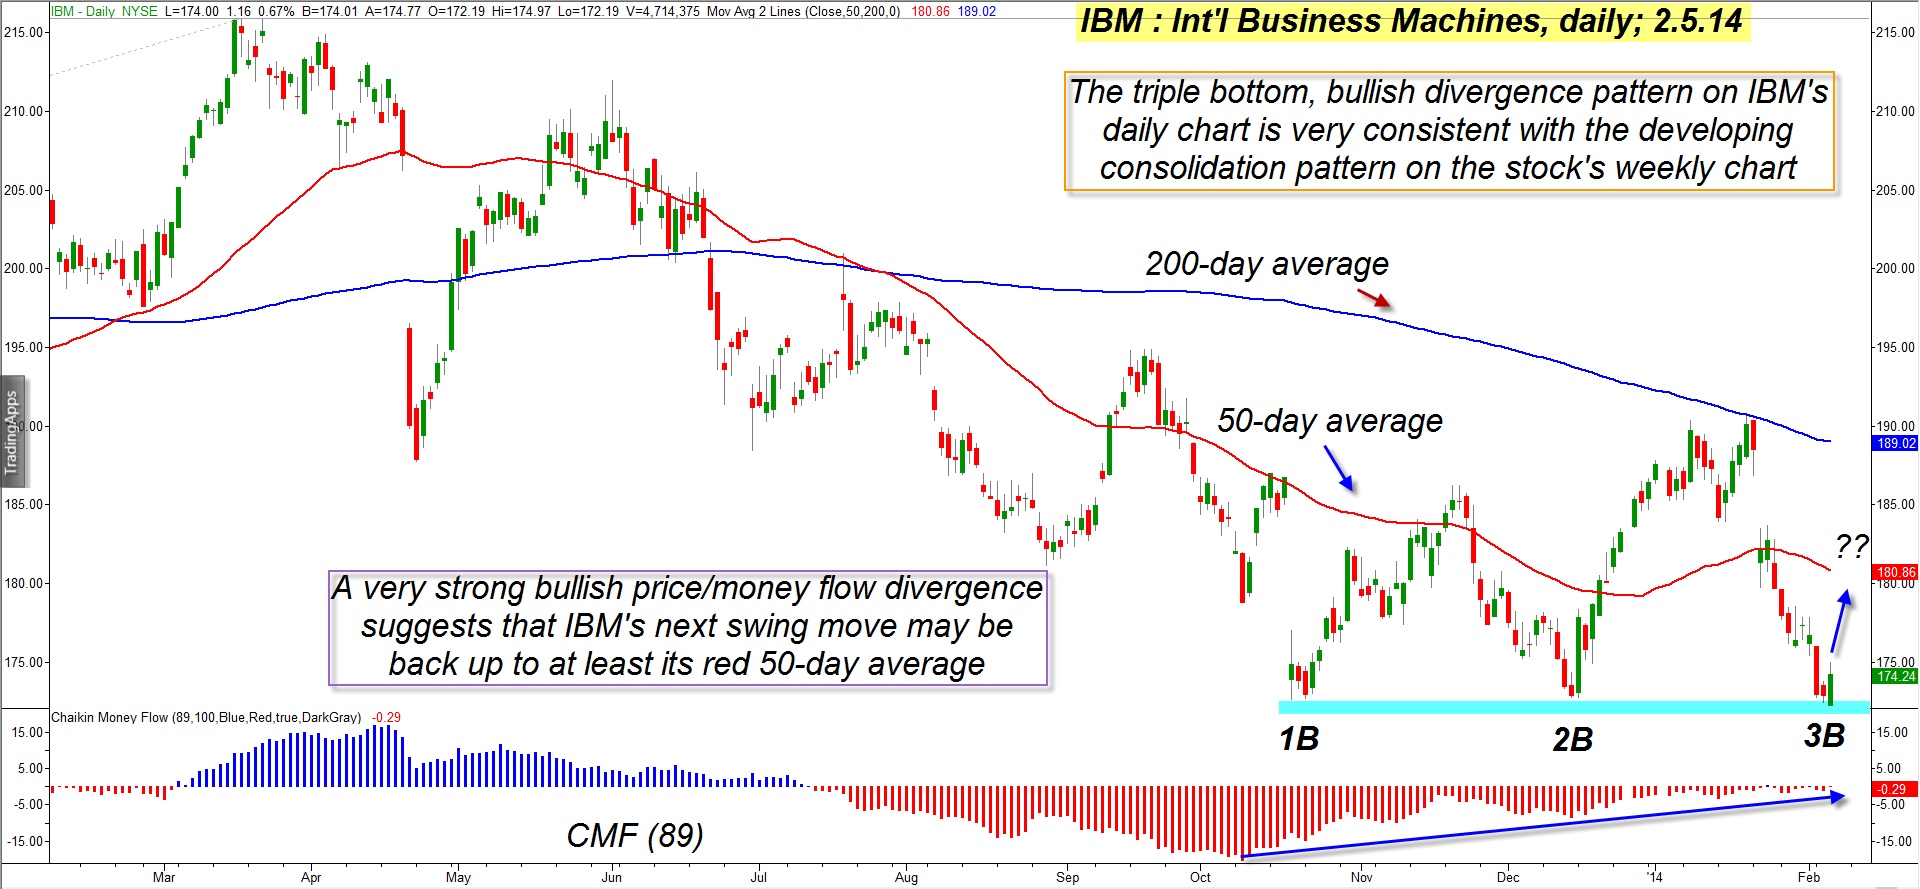
| Figure 1. International Business Machines (IBM): Triple bottom patterns don't show up every day, but when they are accompanied by a major bullish money flow divergence pattern the odds of bullish follow through are greatly enhanced. |
| Graphic provided by: TradeStation. |
| |
| Beginning with the daily chart (Figure 1), we are presented with an image of an incredible, trading textbook quality triple bottom/bullish divergence pattern — the kind that shows up every once in a while, to the delight of technicians and savvy swing traders. The swing lows of the pattern are nicely spaced and that the last swing high was strong implies that the next upswing should have enough power to bring IBM back up to at least its red 50-day average — if not higher. And the ever-rising long-term money flow histogram trend (CMF)(89) also confirms that the "smart money" is busy accumulating IBM on each successive dip down toward the 172.00 area. Logically, the line of least resistance for IBM is toward higher prices on its daily chart. However, the larger scale trend on IBM's weekly chart is still bearish, meaning that swing traders going long on the daily time frame still need to take profits at key resistance zones (such as the 50-day average) before the weekly downtrend reasserts itself. |
|
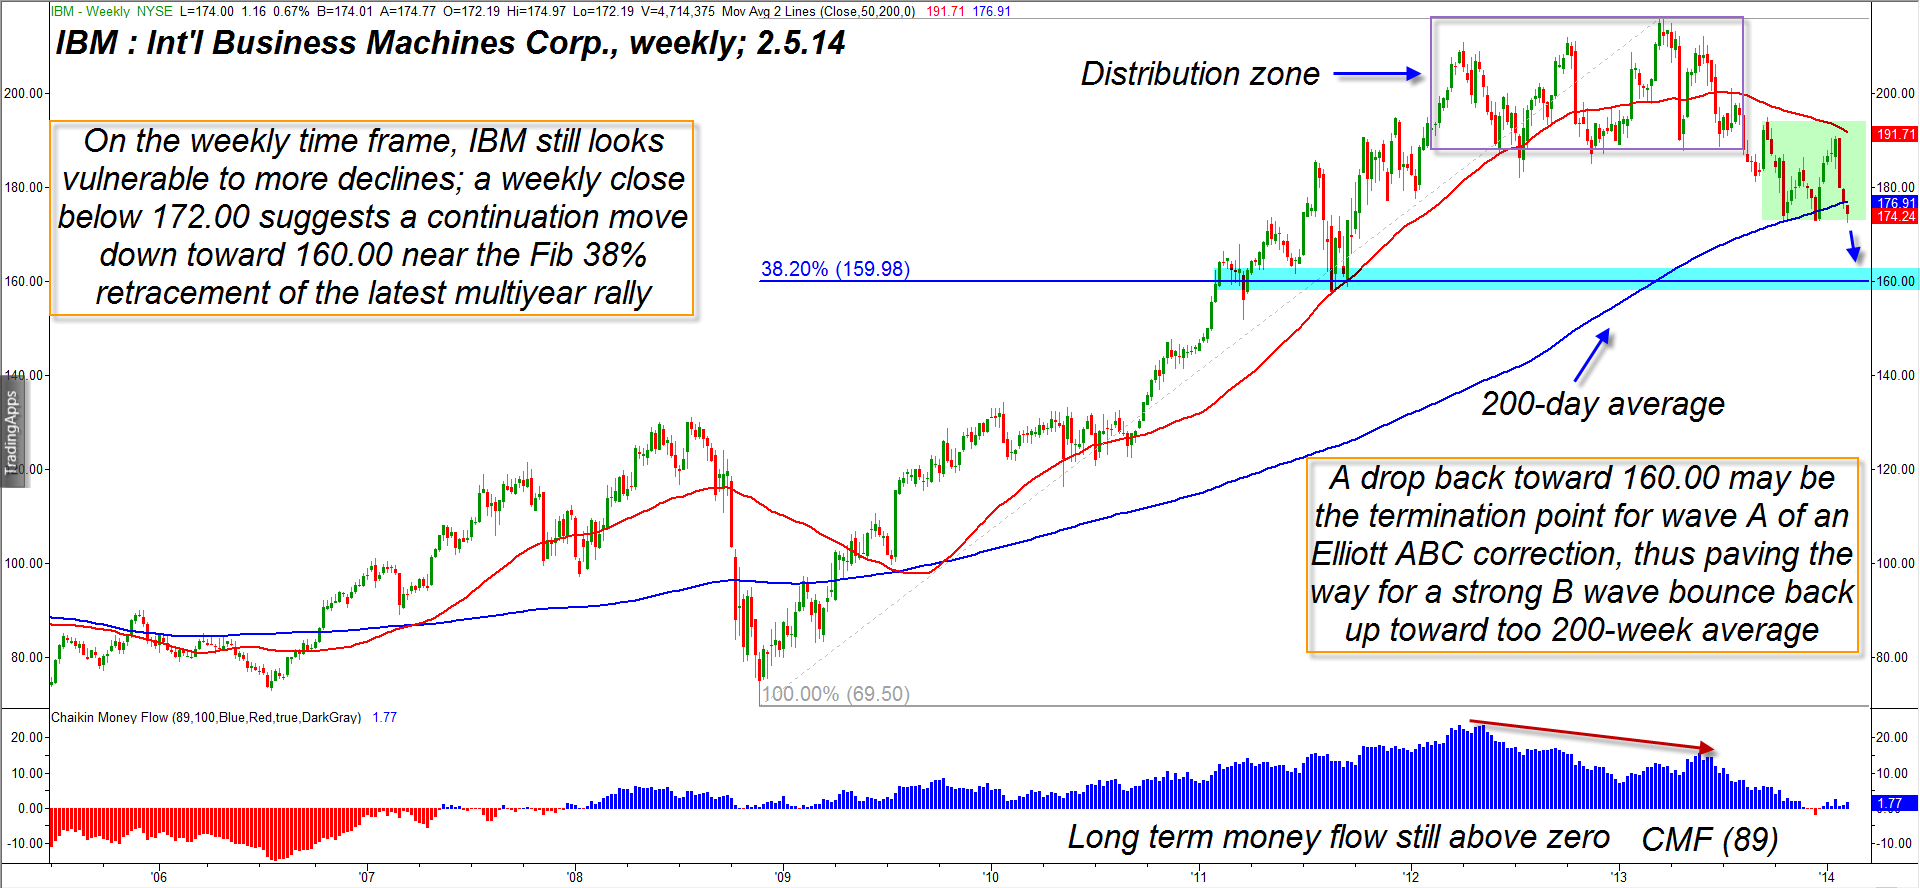
| Figure 2. IBM's weekly chart reveals the major distribution pattern (rectangle) that precipitated its latest correction. Once a potential rally on its daily time frame exhausts itself, look for a retest of 172.00 and a possible wave low near major support at 160.00. |
| Graphic provided by: TradeStation. |
| Graphic provided by: TradeStation RadarScreen. |
| |
| The weekly chart (Figure 2) is more mundane but still offers some useful clues as to the bigger technical picture for IBM; the stock is still near its important 200-week moving average (SMA), although it has now closed below the average for the first time since March 2009. This is of major importance, especially since the stock is also forming a small weekly consolidation pattern (green shaded area); further closes below the 200-week SMA will be a real drag against any near-term rallies and may actually cause the next anticipated decline down toward the Fibonacci 38% retracement level of the entire March 2009 to March 2013 bull run in IBM. The blue shaded support line also shows previous congestion zone price levels that also agree that the 160.00 area will probably be an attractive buy point for value investors. |
| The bottom line for IBM shares looks something like this: 1. Expect a sharp bounce higher from the triple bottom pattern on the daily chart — with both the 50- and 200-day averages sloping lower, taking profits near the 50-day average looks like a very wise thing to do. 2. Once the rally on the daily chart fizzles, look to see yet another retest of 172.00. If that level breaks on big volume, then assume that the weekly downtrend is now back in control and that a decline to the major weekly support levels near 160.00 becomes highly probable. Trade wisely until we meet here again. |
Freelance financial markets writer and online publisher of the Trendzetterz.com S&P 500 Weekly Forecast service.
| Title: | Market consultant and writer |
| Company: | Trendzetterz |
| Address: | 81 Hickory Hollow Drive |
| Crossville, TN 38555 | |
| Phone # for sales: | 904-303-4814 |
| Website: | trendzetterz.com |
| E-mail address: | support@trendzetterz.com |
Traders' Resource Links | |
| Trendzetterz has not added any product or service information to TRADERS' RESOURCE. | |
Click here for more information about our publications!
PRINT THIS ARTICLE

Request Information From Our Sponsors
- StockCharts.com, Inc.
- Candle Patterns
- Candlestick Charting Explained
- Intermarket Technical Analysis
- John Murphy on Chart Analysis
- John Murphy's Chart Pattern Recognition
- John Murphy's Market Message
- MurphyExplainsMarketAnalysis-Intermarket Analysis
- MurphyExplainsMarketAnalysis-Visual Analysis
- StockCharts.com
- Technical Analysis of the Financial Markets
- The Visual Investor
- VectorVest, Inc.
- Executive Premier Workshop
- One-Day Options Course
- OptionsPro
- Retirement Income Workshop
- Sure-Fire Trading Systems (VectorVest, Inc.)
- Trading as a Business Workshop
- VectorVest 7 EOD
- VectorVest 7 RealTime/IntraDay
- VectorVest AutoTester
- VectorVest Educational Services
- VectorVest OnLine
- VectorVest Options Analyzer
- VectorVest ProGraphics v6.0
- VectorVest ProTrader 7
- VectorVest RealTime Derby Tool
- VectorVest Simulator
- VectorVest Variator
- VectorVest Watchdog