

HOT TOPICS LIST
- MACD
- Fibonacci
- RSI
- Gann
- ADXR
- Stochastics
- Volume
- Triangles
- Futures
- Cycles
- Volatility
- ZIGZAG
- MESA
- Retracement
- Aroon
INDICATORS LIST
LIST OF TOPICS
PRINT THIS ARTICLE
by Donald W. Pendergast, Jr.
Down by 11% over the past 11 weeks, are shares of Allstate Corp. (ALL) preparing for an all-out rout or will key support levels soon contain its slide?
Position: N/A
Donald W. Pendergast, Jr.
Freelance financial markets writer and online publisher of the Trendzetterz.com S&P 500 Weekly Forecast service.
PRINT THIS ARTICLE
SUPPORT & RESISTANCE
Allstate: Downtrend Out Of Control Or In Good Hands?
02/11/14 04:18:30 PMby Donald W. Pendergast, Jr.
Down by 11% over the past 11 weeks, are shares of Allstate Corp. (ALL) preparing for an all-out rout or will key support levels soon contain its slide?
Position: N/A
| If you've been a faithful reader of Traders.com Advantage (TCA) for any length of time, you may have noticed that my two favorite technical chart studies are the long-term Chaikin Money flow histogram (CMF)(89) and the visual identification of key support/resistance levels (S/R). By the way, although I use the 89 number since it is Fibonacci-derived, in reality you can also obtain useful analysis results by consistently using a figure between 80 and 125; the specific numbers of 100, 113 and 121 are also quite good, from my own experience. Using the long-term money flow histogram will frequently alert you to the following: 1. An upcoming bearish trend reversal after a sustained rally. 2. An upcoming bullish trend reversal after a sustained downtrend. 3. Low risk pullback buying or short selling opportunities that agree with the dominant trend. Support/resistance (S/R) levels are the structural "framework" upon which all price action on a given chart are connected to and therefore are the primary confirmation price levels for price reversals and breakouts in either direction. Spend as much time as you can studying market price action at major S/R areas and you will be amazed at the valuable secrets that the market will divulge to you — secrets of price action dynamics that tend to repeat over and over again. |
|
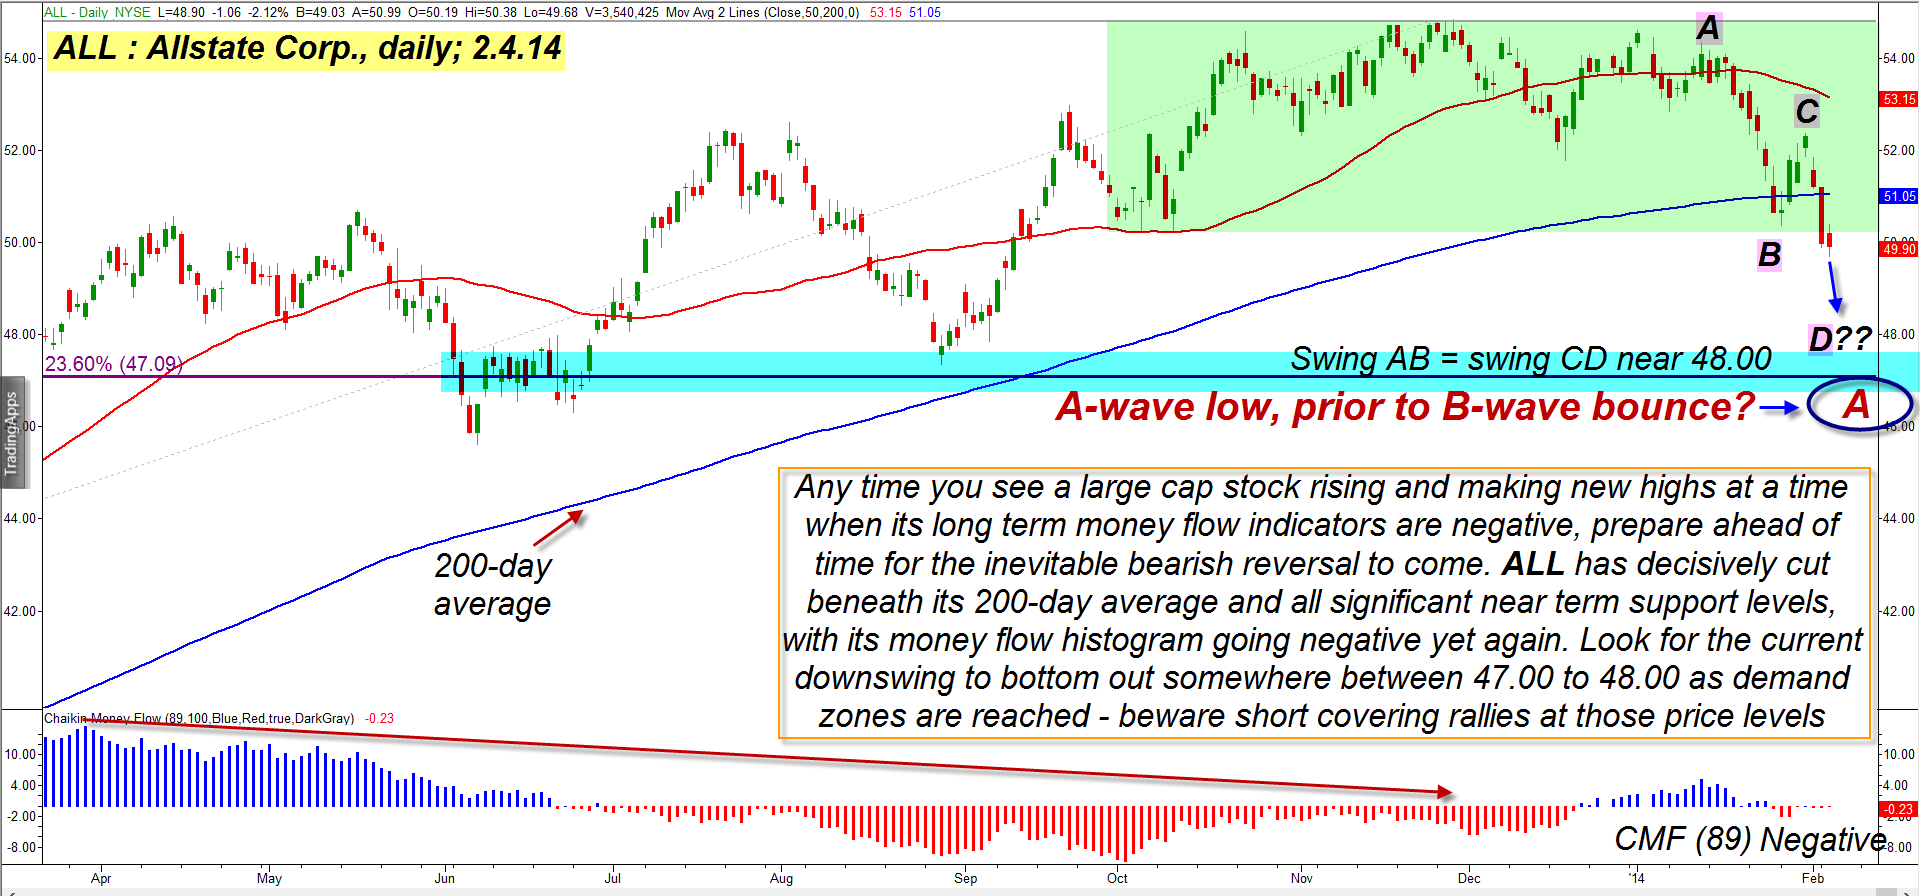
| Figure 1. Allstate Corp. (ALL): the negative money flow trend seen in late 2013 as the stock made new highs was a reliable warning of an impending trend reversal, one that is now underway. |
| Graphic provided by: TradeStation. |
| |
| With that little tutorial over with, the daily chart of ALL in Figure 1 has much to say in both of those technical regards; note the incredible (and fairly rare) divergence between the money flow histogram and price action as ALL gradually worked its way higher to new multiyear highs between April 2013 and November 2013; not only was there a pronounced bearish divergence between the two, but the money flow histogram actually dipped well below — and then stayed below — its zero line for more than six months before finally coming up for air again. While it's hard to explain why a stock would continue to make new highs despite such negative volume and price range action (the two key components of the CMF indicator), all you really need to know is that when a stock makes higher swing highs even as its money flow is ultra bearish, a major correction is looming dead ahead. That correction finally hit after ALL broke down through key support levels from mid-December 2013 to early February 2014, finally making a truly bearish daily close beneath its 200-day average a few sessions ago. Note also that the red 50-day average is now sloping sharply lower, yet another sign that the current price action is starting to morph into a major bearish trend reversal and is not just a garden variety pullback. |
|
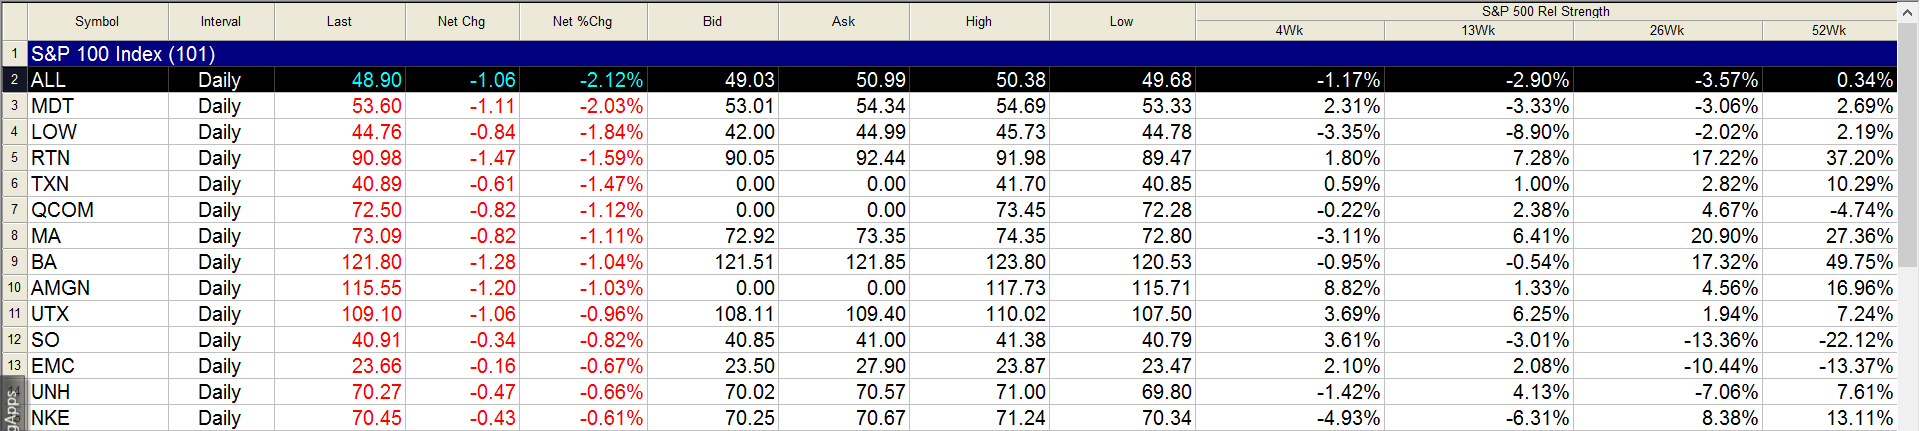
| Figure 2. ALL is now underperforming the .SPX on a variety of time frames; most insurance stocks are also declining as the major US stock indexes seek new support levels. |
| Graphic provided by: TradeStation. |
| Graphic provided by: TradeStation RadarScreen. |
| |
| For those already short ALL, note the AB and CD price swings; once swing CD drops to 48.00 it will equal the length (100%) of swing AB. a dip down toward 47.00 will cause swing CD to equal 127% of swing AB; given the massive amount of chart support between 47.00/48.00 that already exists, these are the most logical stopping/reversal levels at which swing CD should terminate over the next one to three weeks. Short covering rallies may also be expected to be seen once ALL dips back into the obvious "demand" zone in that general support area, so be sure to run a closer trailing stop on your short ALL positions once it goes below 49.00, as bear markets love to take away the profits from inattentive short sellers who fail to monitor their positions closely. Never, ever, take your eyes off a large short stock/ETF position in your account as it begins to approach major support levels or Fibonacci ratio swing targets or you will eventually get creamed by a violent short covering rally; if you learn only one bit of valuable stock market wisdom this year, then that should be the one, as it will save you tons of forfeited open profits as you progress through your trading career. Once ALL puts in some key reversal patterns near 47.00/48.00, you may wish to wait for another bounce before shorting again, as going long a B wave rally could be risky, especially given the negative money flow trend in the stock at present. Use Fibonacci swing ratios and money flow/volume exhaustion patterns to help you get back in on the short side in ALL once the B wave finally exhausts itself prior to the next nasty decline in this key insurance sector issue. Trade wisely until we meet here again. |
Freelance financial markets writer and online publisher of the Trendzetterz.com S&P 500 Weekly Forecast service.
| Title: | Market consultant and writer |
| Company: | Trendzetterz |
| Address: | 81 Hickory Hollow Drive |
| Crossville, TN 38555 | |
| Phone # for sales: | 904-303-4814 |
| Website: | trendzetterz.com |
| E-mail address: | support@trendzetterz.com |
Traders' Resource Links | |
| Trendzetterz has not added any product or service information to TRADERS' RESOURCE. | |
Click here for more information about our publications!
PRINT THIS ARTICLE

Request Information From Our Sponsors
- StockCharts.com, Inc.
- Candle Patterns
- Candlestick Charting Explained
- Intermarket Technical Analysis
- John Murphy on Chart Analysis
- John Murphy's Chart Pattern Recognition
- John Murphy's Market Message
- MurphyExplainsMarketAnalysis-Intermarket Analysis
- MurphyExplainsMarketAnalysis-Visual Analysis
- StockCharts.com
- Technical Analysis of the Financial Markets
- The Visual Investor
- VectorVest, Inc.
- Executive Premier Workshop
- One-Day Options Course
- OptionsPro
- Retirement Income Workshop
- Sure-Fire Trading Systems (VectorVest, Inc.)
- Trading as a Business Workshop
- VectorVest 7 EOD
- VectorVest 7 RealTime/IntraDay
- VectorVest AutoTester
- VectorVest Educational Services
- VectorVest OnLine
- VectorVest Options Analyzer
- VectorVest ProGraphics v6.0
- VectorVest ProTrader 7
- VectorVest RealTime Derby Tool
- VectorVest Simulator
- VectorVest Variator
- VectorVest Watchdog