HOT TOPICS LIST
- MACD
- Fibonacci
- RSI
- Gann
- ADXR
- Stochastics
- Volume
- Triangles
- Futures
- Cycles
- Volatility
- ZIGZAG
- MESA
- Retracement
- Aroon
INDICATORS LIST
LIST OF TOPICS
PRINT THIS ARTICLE
by Donald W. Pendergast, Jr.
Up by more than 80% between November 2012 and January 2014, shares of MetLife are falling fast now; look for major support levels to be hit soon.
Position: N/A
Donald W. Pendergast, Jr.
Freelance financial markets writer and online publisher of the Trendzetterz.com S&P 500 Weekly Forecast service.
PRINT THIS ARTICLE
SUPPORT & RESISTANCE
MetLife: Dropping Hard - Into Major Support
02/10/14 05:00:10 PMby Donald W. Pendergast, Jr.
Up by more than 80% between November 2012 and January 2014, shares of MetLife are falling fast now; look for major support levels to be hit soon.
Position: N/A
| The so-called "permabears" must be smiling right now; their long-awaited major sell-off in the US stock indexes is now unfolding — and with great power and speed. At times like this, it's easy to get carried away and start projecting that the Dow 30 or S&P 500 indexes will be 20, 30 or even 50% lower than they are now by such and such a date, but level-headed technicians and chartists know that the best way to forecast future price levels is by using rational tools such as these: * AB=CD Fibonacci swing ratios * Continuation pattern price projections * Fibonacci retracement confluence zones * Prior support/resistance areas * Price/momentum divergences * Price money flow divergences * Volume exhaustion patterns * Key reversal patterns * Major moving averages |

|
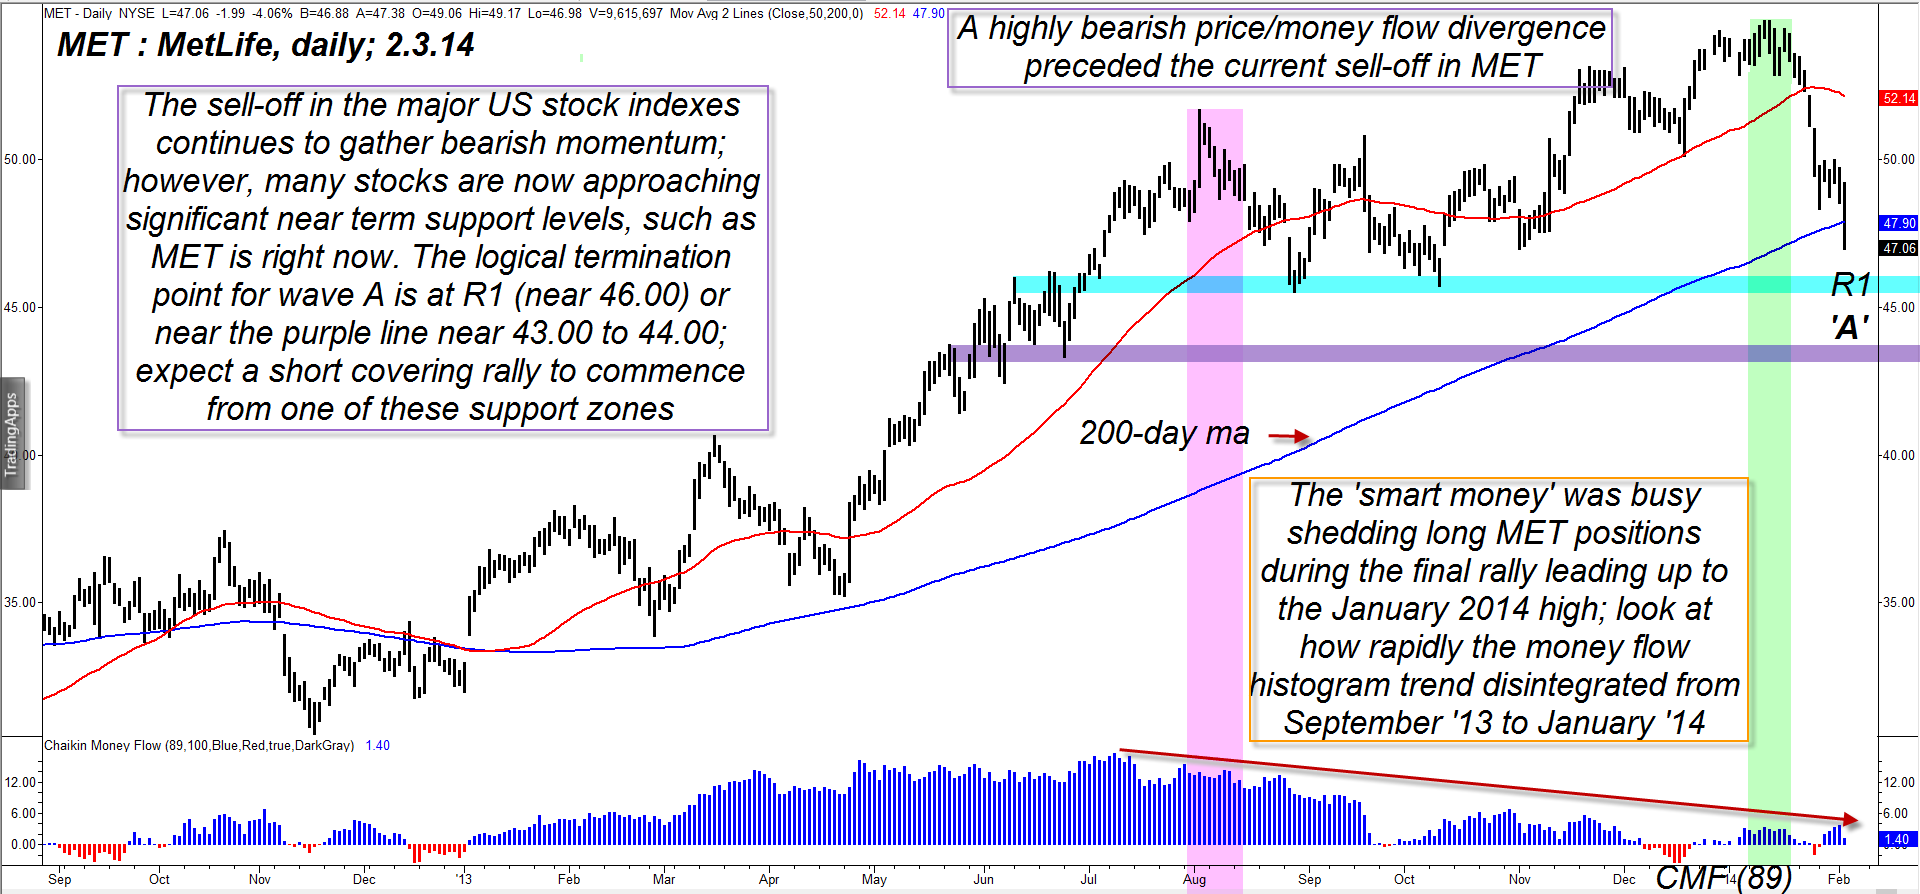
| Figure 1. Although MetLife's (MET) current decline has plenty of negative momentum pushing it lower, either of the two support areas on the chart could offer a decent bullish bounce in the days ahead. |
| Graphic provided by: TradeStation. |
| |
| Truly seasoned technicians and trading advisors will be able to look at all of these key technical elements and be able to make high probability price projections — the kind that can help keep them (and their clients) from overstaying their positions and to help them get ready for the next major bullish or bearish turn in the markets. In the case of MetLife (MET) shares, technicians can already find two logical, high probability support zones (Figure 1), as follows: 1. Support R1 which is near 46.00 2. Major support, which is between 43.00 and 44.00 One hint that these nearby support zones will hold back further selling (for the time being) is that the 89-day Chaikin Money flow histogram (CMF)(89) is, incredibly, still above its zero line. This tells us that the "smart money" is likely to jump back in to go long MET in anticipation of a proportional bullish bounce that will retrace 25 to 50% of the decline since mid-January 2014. And again, they will be relying on the price forecasting tools already mentioned above in order to alert them to the lowest risk time to start jacking the price of MET up higher for a week or two before another, more significant wave of selling ensues. |

|
| Figure 2. MET is now underperforming the S&P 500 index over the last 4-, 13- and 26-week time periods but is still stronger than the index over the past 12 months. |
| Graphic provided by: TradeStation. |
| Graphic provided by: TradeStation RadarScreen. |
| |
| Elliott Wavers are well-skilled in anticipating/identifying ABC corrective wave patterns after long, sustained rallies and selloffs (once a clear 5-wave impulse pattern has finally played out) and from the looks of what's unfolding on MET's daily chart in Figure 1, the current down wave appears to be the A wave portion of what may morph into a full blown ABC correction. Watch for signs of key bullish reversal patterns near 46.00 and then 43.00 to 44.00 to help provide confirmation that wave A is complete and that a B wave bounce is underway. Once the B wave peaks (again, look for signs of volume exhaustion, Fibonacci swing ratios, etc. to provide termination confirmation) you will be in a good position to go short MET as a bearish C wave starts its descent to price levels that could take the stock into the upper $30 range by the middle of this year. Also be aware that many other large caps are also in extended bearish A waves now and that many could also find meaningful support from which to bounce in the next week or two. Trade wisely until we meet here again. |
Freelance financial markets writer and online publisher of the Trendzetterz.com S&P 500 Weekly Forecast service.
| Title: | Market consultant and writer |
| Company: | Trendzetterz |
| Address: | 81 Hickory Hollow Drive |
| Crossville, TN 38555 | |
| Phone # for sales: | 904-303-4814 |
| Website: | trendzetterz.com |
| E-mail address: | support@trendzetterz.com |
Traders' Resource Links | |
| Trendzetterz has not added any product or service information to TRADERS' RESOURCE. | |
Click here for more information about our publications!
PRINT THIS ARTICLE

Request Information From Our Sponsors
- StockCharts.com, Inc.
- Candle Patterns
- Candlestick Charting Explained
- Intermarket Technical Analysis
- John Murphy on Chart Analysis
- John Murphy's Chart Pattern Recognition
- John Murphy's Market Message
- MurphyExplainsMarketAnalysis-Intermarket Analysis
- MurphyExplainsMarketAnalysis-Visual Analysis
- StockCharts.com
- Technical Analysis of the Financial Markets
- The Visual Investor
- VectorVest, Inc.
- Executive Premier Workshop
- One-Day Options Course
- OptionsPro
- Retirement Income Workshop
- Sure-Fire Trading Systems (VectorVest, Inc.)
- Trading as a Business Workshop
- VectorVest 7 EOD
- VectorVest 7 RealTime/IntraDay
- VectorVest AutoTester
- VectorVest Educational Services
- VectorVest OnLine
- VectorVest Options Analyzer
- VectorVest ProGraphics v6.0
- VectorVest ProTrader 7
- VectorVest RealTime Derby Tool
- VectorVest Simulator
- VectorVest Variator
- VectorVest Watchdog
