HOT TOPICS LIST
- MACD
- Fibonacci
- RSI
- Gann
- ADXR
- Stochastics
- Volume
- Triangles
- Futures
- Cycles
- Volatility
- ZIGZAG
- MESA
- Retracement
- Aroon
INDICATORS LIST
LIST OF TOPICS
PRINT THIS ARTICLE
by Koos van der Merwe
Is the Volatility Index (VIX) forecasting the movement of the market?
Position: Buy
Koos van der Merwe
Has been a technical analyst since 1969, and has worked as a futures and options trader with First Financial Futures in Johannesburg, South Africa.
PRINT THIS ARTICLE
VELOCITY
Do You Follow The Vix?
02/07/14 04:37:25 PMby Koos van der Merwe
Is the Volatility Index (VIX) forecasting the movement of the market?
Position: Buy
| Bob Pisani of CNBC often refers to the VIX as a leader of market direction. This week he said the VIX is at its highest level in over a year, suggesting that stocks are oversold. How correct is he in his analysis? Note that in all my charts I have inverted the chart of the VIX so that you can visually compare the two charts more easily. |

|
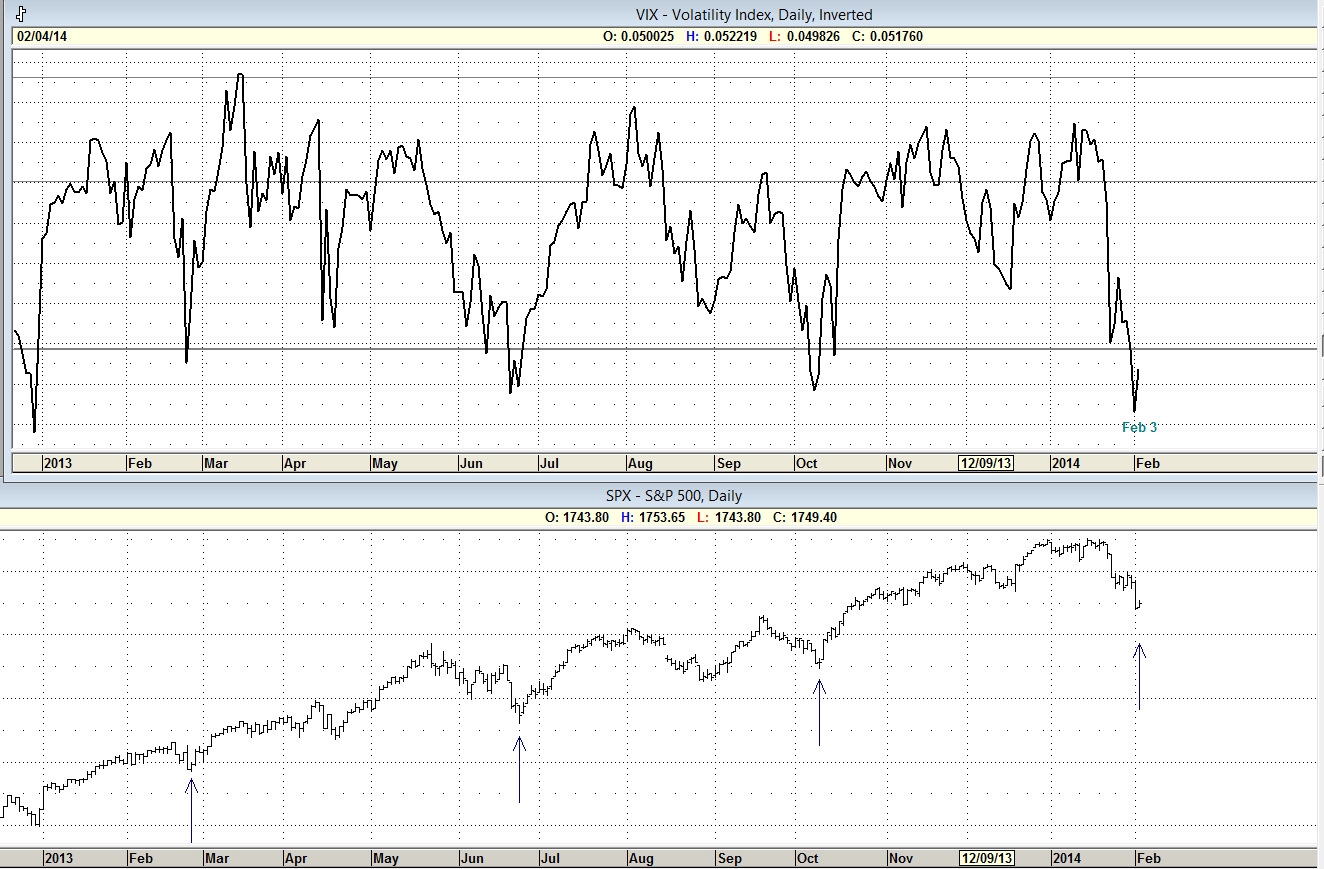
| Figure 1. Chart of the Dow showing the Inverted VIX. |
| Graphic provided by: AdvancedGET. |
| |
| The chart in Figure 1 is a daily chart of the Dow Jones Industrial Average (DJIA) with an inverted chart of the VIX. Note how consistent the inverted VIX is in calling market bottoms. The chart shows the VIX calling a bottom in the Dow for February 3, 2014. The DJIA, according to the chart, should now start strengthening. |

|
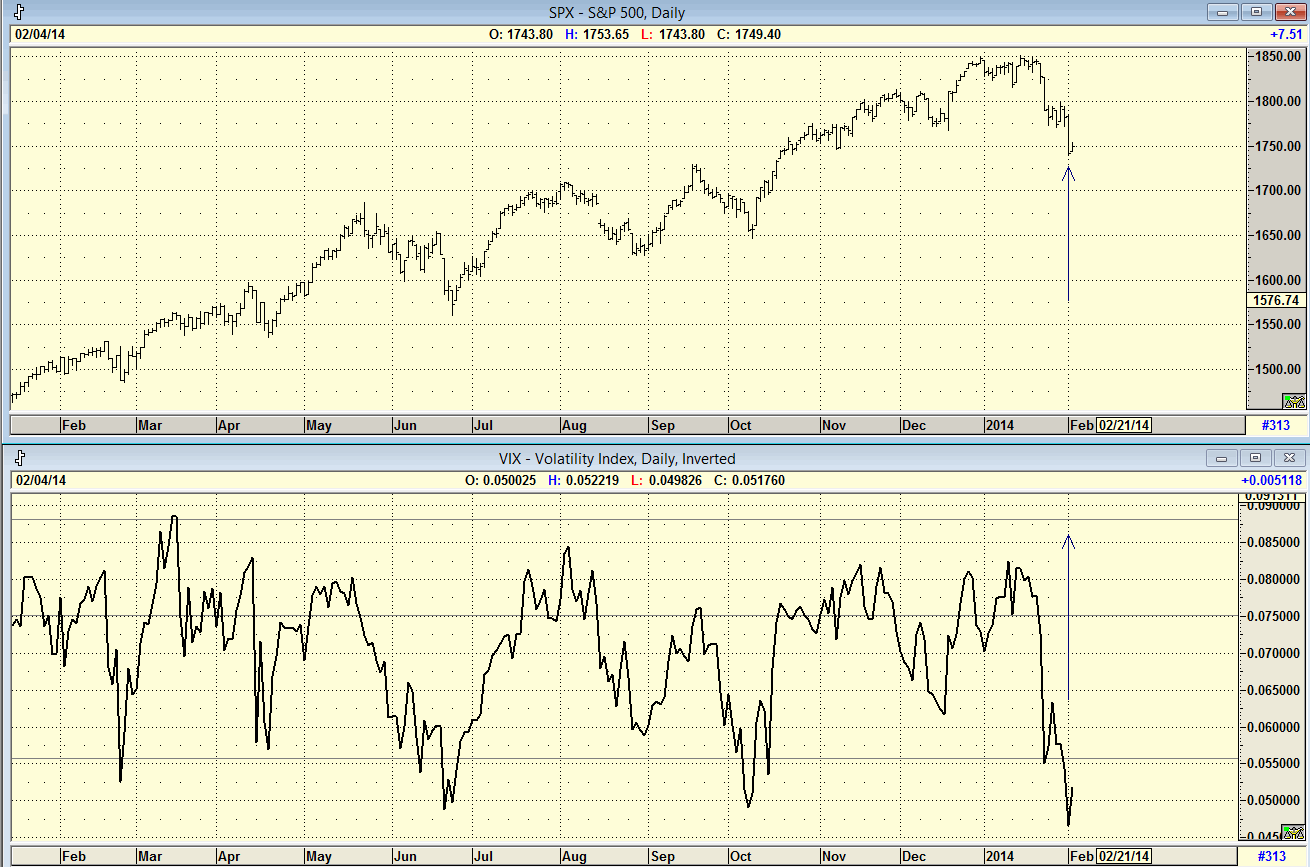
| Figure 2. S&P500 daily chart with the inverted VIX. |
| Graphic provided by: AdvancedGET. |
| |
| The chart in Figure 2 is a chart of the S&P500 Index with the inverted VIX. Once again notice how the VIX successfully called the turning points of the index. The S&P500 should now be strengthening. |

|
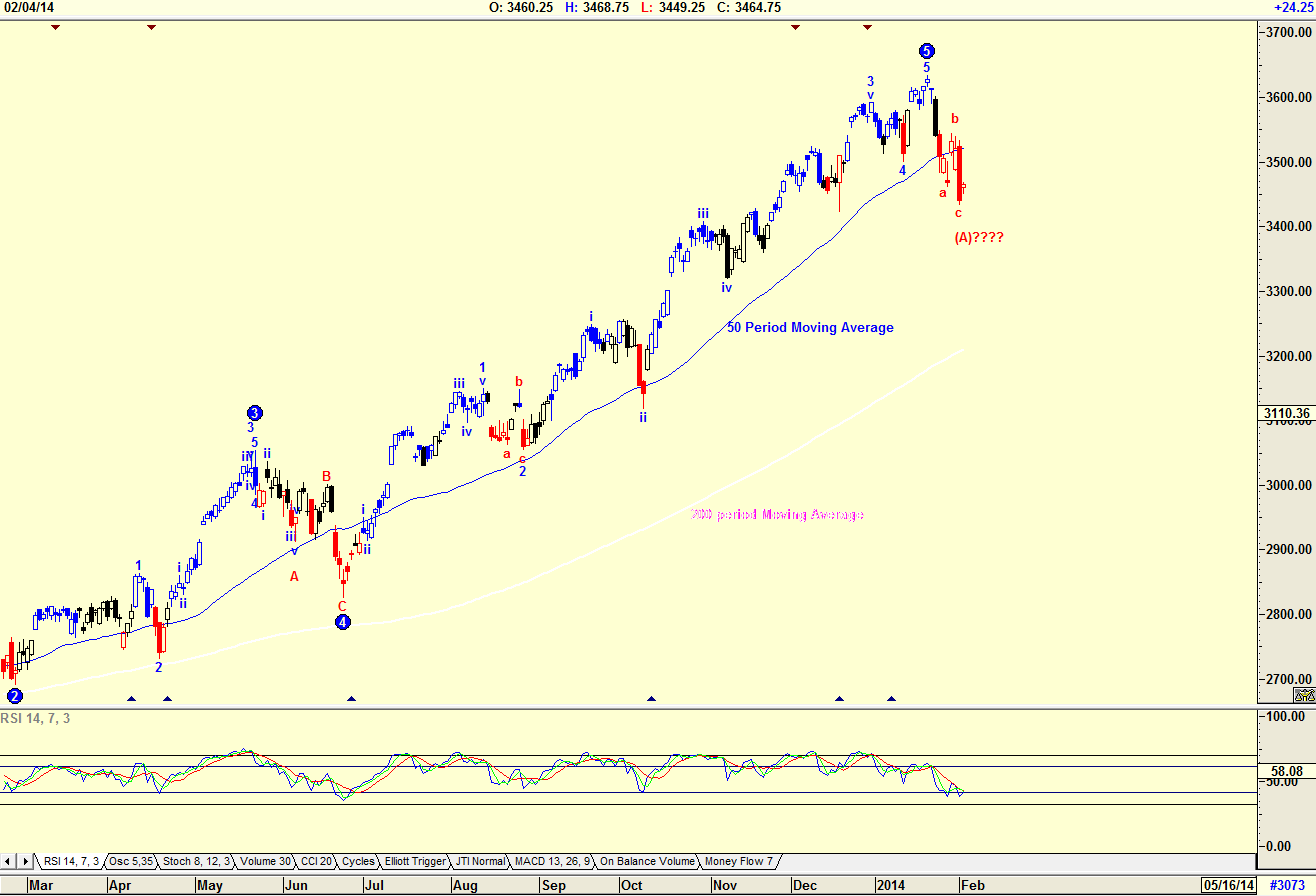
| Figure 3. Daily Elliott Wave count of the Nasdaq. |
| Graphic provided by: AdvancedGET. |
| |
| On the daily chart of the Nasdaq 100 index in Figure 3, the VIX will also suggest a turning point. I have therefore shown the 14-period RSI indicator which is suggesting a bottom. Note that the Nasdaq index is below the 50-period moving average (MA) but above the 200-period MA. Also note the Elliott Wave count which is suggesting an ABC correction after a WAVE 5. The Nasdaq could now correct in a Wave 1 up or correct in a Wave B up with a Wave C down to follow. The latter seems likely, suggesting that the index could strengthen into April with the "sell in May" mantra following. This would, of course, apply to all the indexes. |

|
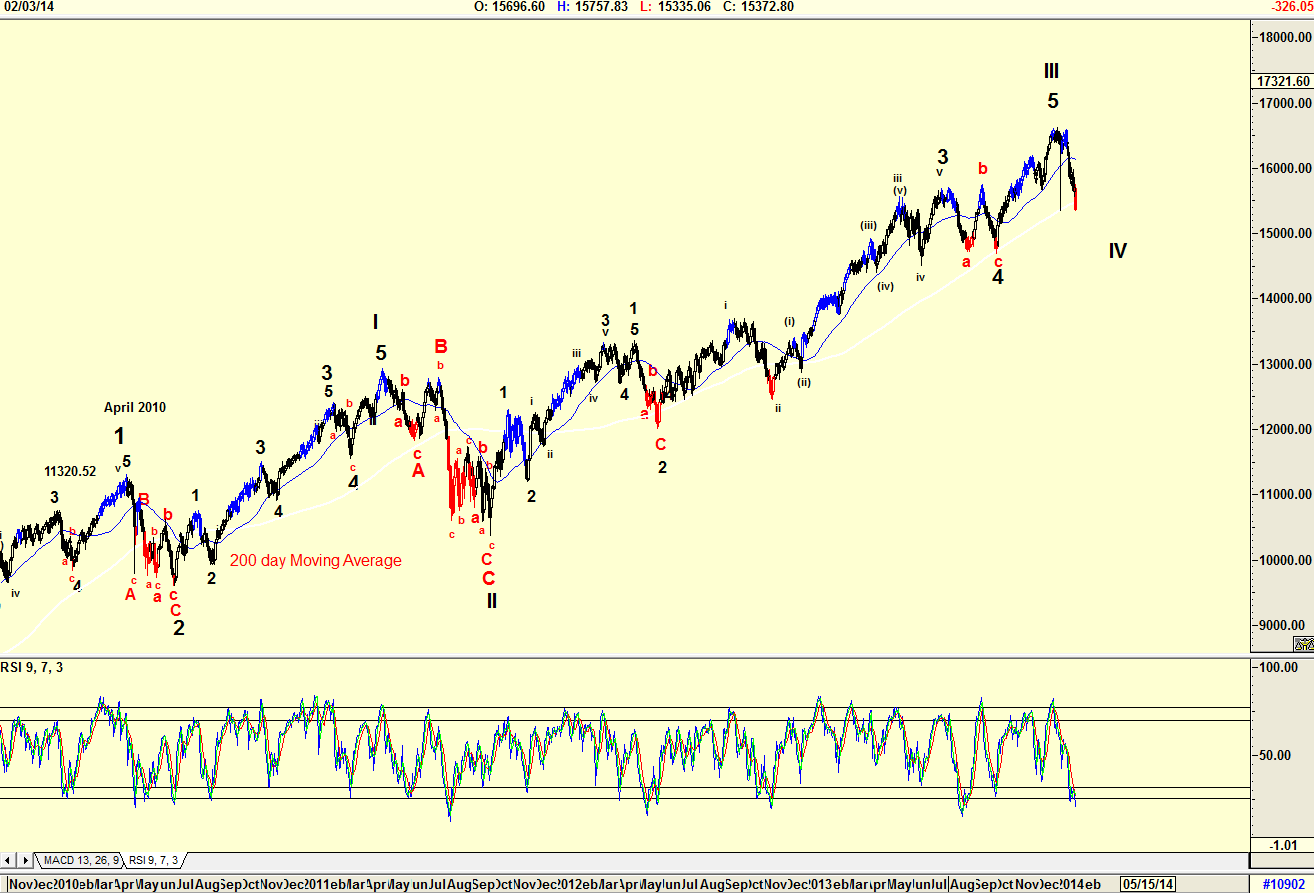
| Figure 4. Daily Elliott Wave count of the Dow suggesting strength ahead in a Wave V. |
| Graphic provided by: AdvancedGET. |
| |
| The chart in Figure 4 is a daily chart of the DJIA with an Elliott Wave count suggesting that the DJIA could be in a WAVE IV correction. This suggests that the Dow should rise in a WAVE V before a strong ABC correction that could bring it back to the 15000 level. That the Dow is testing and did move below the 200-day moving average is a concern, but with the RSI at oversold levels, the chances of the Dow rising are more than likely. Many known analysts are calling for a strong correction to take place in the near future. They are not wrong. A correction will take place but only when the VIX inverted as shown on the charts rises strongly. An Elliott Wave count of the DJIA suggests that the Dow should rise in a WAVE V. The "sell in May and go away" mantra will come into play within the next few months, the month of January showed negative performance, and there's so much negative sentiment out there fed by those "in the know". With a new Federal Reserve Chairman and the uncertainty as to what her plans are regarding the US economy, anyone can call for a strong market correction, knowing there is a good chance they could be correct and make a name for themselves. When CNBC advertises "Blue Chips Near A Correction" you could argue, "When In Doubt Stay Out." The question of course is do you stay out or do you buy stocks on the dips? The VIX at the moment is saying, buy. |
Has been a technical analyst since 1969, and has worked as a futures and options trader with First Financial Futures in Johannesburg, South Africa.
| Address: | 3256 West 24th Ave |
| Vancouver, BC | |
| Phone # for sales: | 6042634214 |
| E-mail address: | petroosp@gmail.com |
Click here for more information about our publications!
Comments
Date: 02/14/14Rank: 5Comment:

|

Request Information From Our Sponsors
- StockCharts.com, Inc.
- Candle Patterns
- Candlestick Charting Explained
- Intermarket Technical Analysis
- John Murphy on Chart Analysis
- John Murphy's Chart Pattern Recognition
- John Murphy's Market Message
- MurphyExplainsMarketAnalysis-Intermarket Analysis
- MurphyExplainsMarketAnalysis-Visual Analysis
- StockCharts.com
- Technical Analysis of the Financial Markets
- The Visual Investor
- VectorVest, Inc.
- Executive Premier Workshop
- One-Day Options Course
- OptionsPro
- Retirement Income Workshop
- Sure-Fire Trading Systems (VectorVest, Inc.)
- Trading as a Business Workshop
- VectorVest 7 EOD
- VectorVest 7 RealTime/IntraDay
- VectorVest AutoTester
- VectorVest Educational Services
- VectorVest OnLine
- VectorVest Options Analyzer
- VectorVest ProGraphics v6.0
- VectorVest ProTrader 7
- VectorVest RealTime Derby Tool
- VectorVest Simulator
- VectorVest Variator
- VectorVest Watchdog
