HOT TOPICS LIST
- MACD
- Fibonacci
- RSI
- Gann
- ADXR
- Stochastics
- Volume
- Triangles
- Futures
- Cycles
- Volatility
- ZIGZAG
- MESA
- Retracement
- Aroon
INDICATORS LIST
LIST OF TOPICS
PRINT THIS ARTICLE
by Donald W. Pendergast, Jr.
Shares of Starbucks are declining as a minor negative price/money flow divergence plays out.
Position: N/A
Donald W. Pendergast, Jr.
Freelance financial markets writer and online publisher of the Trendzetterz.com S&P 500 Weekly Forecast service.
PRINT THIS ARTICLE
SUPPORT & RESISTANCE
Starbucks: Proportional Correction Continues
02/06/14 04:10:40 PMby Donald W. Pendergast, Jr.
Shares of Starbucks are declining as a minor negative price/money flow divergence plays out.
Position: N/A
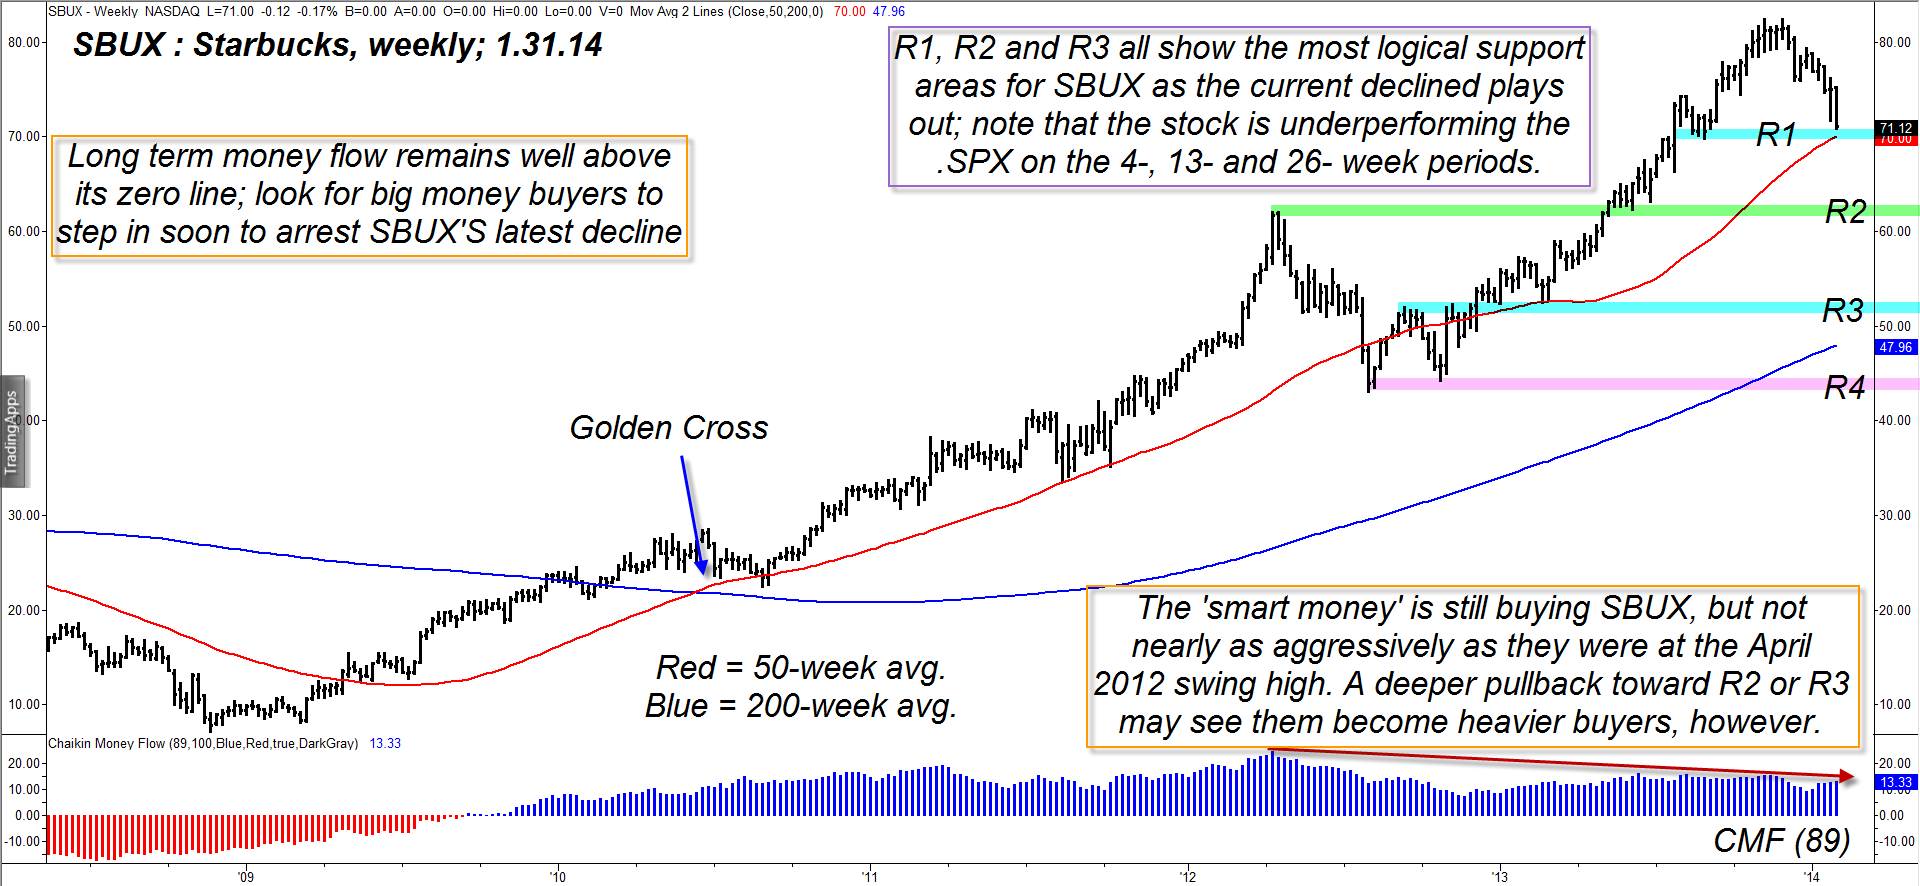
| Starbucks (SBUX) shares truly outperformed the broad market indexes over the past five years, rising by more than 1000% since the major low in the S&P 500 index (.SPX) was made in March 2009. The strength and trend worthiness of the advance was remarkable; long-term investors and smart money interests obviously made the right decision by sticking with this issue over the long haul — even during the rough patches of turbulence that shook the US markets from time to time in 2010, 2011, 2012 and 2013. The stock is now correcting in a very gentle fashion and is closing in on the first of three significant support levels; any one of which could act as the launching pad for more advances. Here's a closer look at SBUX's daily chart (Figure 1). |

|
| Figure 1. Weekly chart of Starbucks (SBUX): compared to some other large cap issues, the recent decline in SBUX has been rather tame; look for a bounce from the red 50-week average, followed by a more substantial decline toward at least R2 in the weeks ahead. |
| Graphic provided by: TradeStation. |
| |
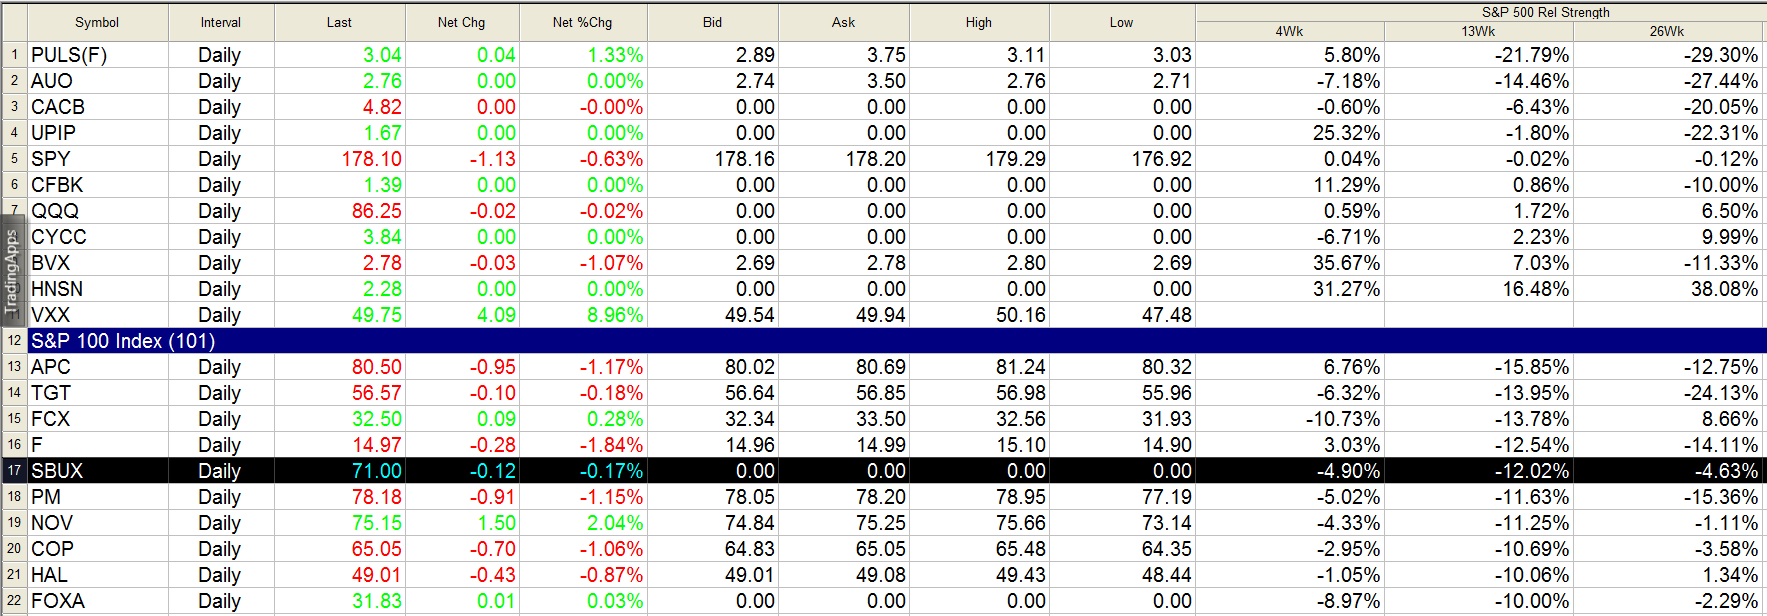
| Compared to some of its large cap brethren that are .SPX stable mates, the recent sell-off in SBUX looks to be relatively tame; this is not a massive ABC correction underway (at least not yet) and appears to be a more modest, proportional pullback against the prevailing trend. SBUX completed a golden cross (50-week moving average, or SMA, crossing above its 200-week SMA) way back in June 2010 and has traded above the 200-week SMA since March 2010. Both of these key moving averages are still sloping higher, also a good long-term trend following confirmation. But after such a massive, nearly 60-month rally, it's not surprising to witness the gradual deterioration of the 89-week Chaikin Money flow histogram (CMF)(89); note that the histogram was much higher at the April 2012 swing high than at any time since, despite SBUX trading at substantially higher prices now. Relative strength studies also reveal that SBUX is significantly underperforming the .SPX over the past 4-, 13- and 26-week periods. Institutional traders, particularly those who seek to build and maintain longer term positions will usually focus their buying activity on higher relative strength issues, but even so, SBUX may prove to be a good buying opportunity down near R2 and R3, even if its relative strength is still substandard. |

|
| Figure 2. SBUX has been underperforming the .SPX over the past 4-, 13- and 26-week periods. |
| Graphic provided by: TradeStation. |
| Graphic provided by: TradeStation RadarScreen. |
| |
| Here are some ideas on how to manage and/or play SBUX's correction: For existing longs who still have an open profit, watch for SBUX to bounce again from its 50-week average. A weekly close beneath the average after a minor bounce higher is a fairly straightforward exit signal; wait to see how the stock responds at the R2 and R3 support levels before considering a new long position again. If you're already underwater in your open SBUX long position, well, use any bounce from the 50-week average to help bail yourself out of the trade now, before further declines wreak havoc on your account equity. If you're a skilled short seller, use a bounce higher from R1 to locate a low risk short entry point on a 45- to 90-minute chart, in anticipation of further declines down to R2. It's possible that the current downswing is a corrective wave A (or just the first leg of wave A) and that a bounce higher in wave B could offer a superb way to get short for a powerful C wave that takes price down toward R2 or R3. Elliott Wave and price cycle analysis strongly suggests the major US stock indexes still have plenty more downside left in them until early this summer, so be sure to hedge any long stock positions you plan on holding through any upcoming downdraft. And be sure to keep some buying power intact for when the next major cycle lows form in the .SPX during the second half of 2014. Trade wisely until we meet here again. |
Freelance financial markets writer and online publisher of the Trendzetterz.com S&P 500 Weekly Forecast service.
| Title: | Market consultant and writer |
| Company: | Trendzetterz |
| Address: | 81 Hickory Hollow Drive |
| Crossville, TN 38555 | |
| Phone # for sales: | 904-303-4814 |
| Website: | trendzetterz.com |
| E-mail address: | support@trendzetterz.com |
Traders' Resource Links | |
| Trendzetterz has not added any product or service information to TRADERS' RESOURCE. | |
Click here for more information about our publications!
PRINT THIS ARTICLE

Request Information From Our Sponsors
- VectorVest, Inc.
- Executive Premier Workshop
- One-Day Options Course
- OptionsPro
- Retirement Income Workshop
- Sure-Fire Trading Systems (VectorVest, Inc.)
- Trading as a Business Workshop
- VectorVest 7 EOD
- VectorVest 7 RealTime/IntraDay
- VectorVest AutoTester
- VectorVest Educational Services
- VectorVest OnLine
- VectorVest Options Analyzer
- VectorVest ProGraphics v6.0
- VectorVest ProTrader 7
- VectorVest RealTime Derby Tool
- VectorVest Simulator
- VectorVest Variator
- VectorVest Watchdog
- StockCharts.com, Inc.
- Candle Patterns
- Candlestick Charting Explained
- Intermarket Technical Analysis
- John Murphy on Chart Analysis
- John Murphy's Chart Pattern Recognition
- John Murphy's Market Message
- MurphyExplainsMarketAnalysis-Intermarket Analysis
- MurphyExplainsMarketAnalysis-Visual Analysis
- StockCharts.com
- Technical Analysis of the Financial Markets
- The Visual Investor
