

HOT TOPICS LIST
- MACD
- Fibonacci
- RSI
- Gann
- ADXR
- Stochastics
- Volume
- Triangles
- Futures
- Cycles
- Volatility
- ZIGZAG
- MESA
- Retracement
- Aroon
INDICATORS LIST
LIST OF TOPICS
PRINT THIS ARTICLE
by Donald W. Pendergast, Jr.
Every stock has a period of correction and/or consolidation after enjoying a strong rally phase, but in the case of BestBuy (BBY), its current selloff is a major bearish trend reversal, rather than a proportional correction against the prior uptrend. Now that a key Fibonacci support level has been breached, will the next lower "last ditch" Fib support finally be enough to initiate a relief rally? Here's a closer look now.
Position: N/A
Donald W. Pendergast, Jr.
Freelance financial markets writer and online publisher of the Trendzetterz.com S&P 500 Weekly Forecast service.
PRINT THIS ARTICLE
FIBONACCI
BestBuy: Will Its Next Support Level Hold?
02/04/14 04:13:27 PMby Donald W. Pendergast, Jr.
Every stock has a period of correction and/or consolidation after enjoying a strong rally phase, but in the case of BestBuy (BBY), its current selloff is a major bearish trend reversal, rather than a proportional correction against the prior uptrend. Now that a key Fibonacci support level has been breached, will the next lower "last ditch" Fib support finally be enough to initiate a relief rally? Here's a closer look now.
Position: N/A
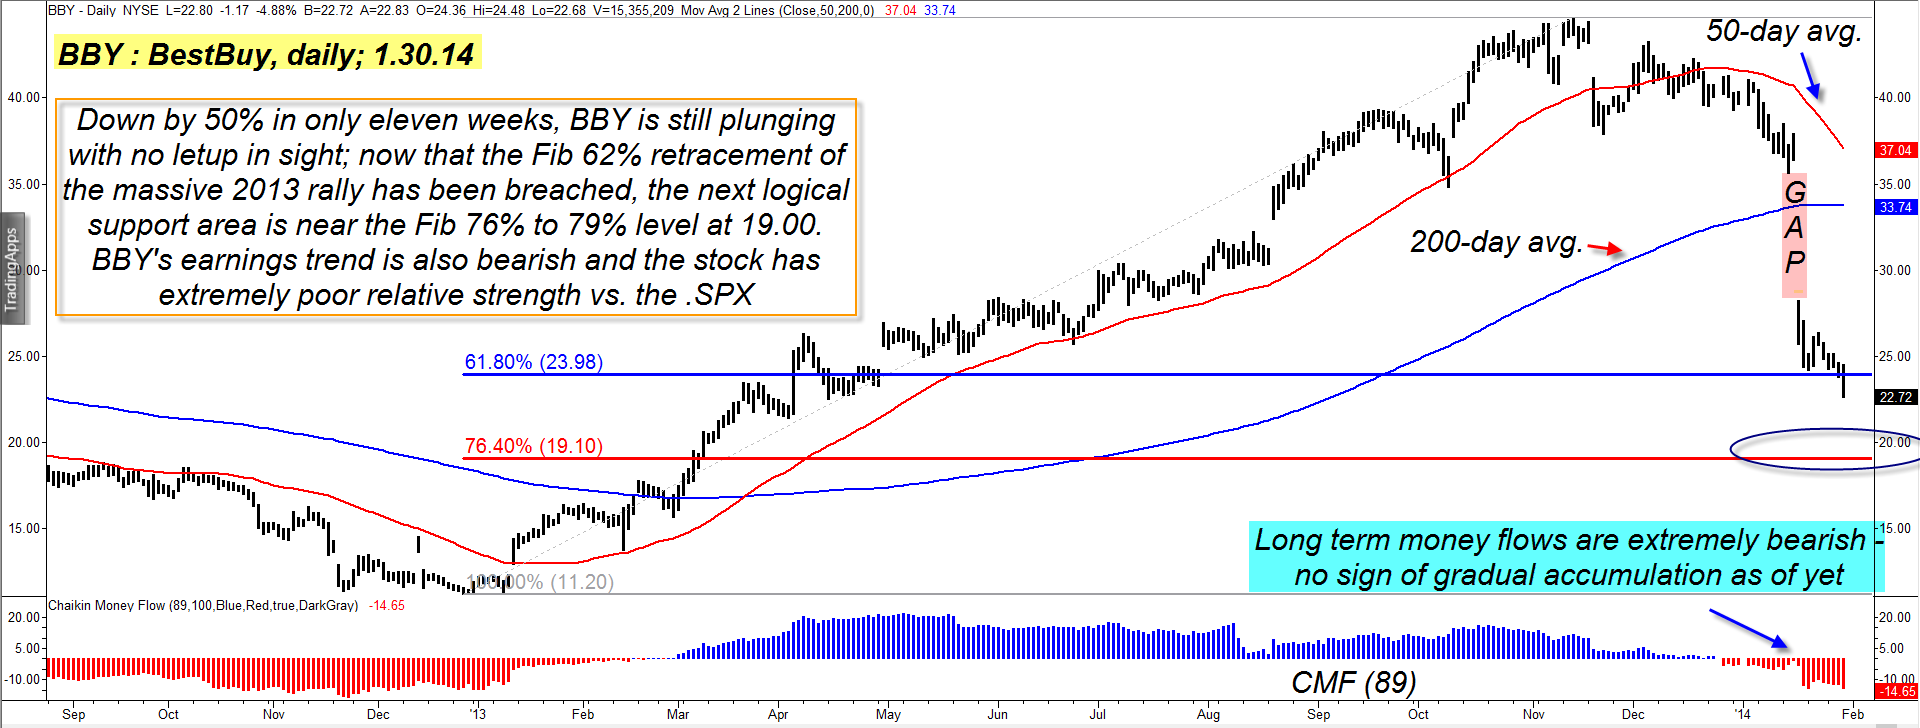
| Shares of BestBuy have had a rough go of it since November 2013; after peaking on November 13, 2013, the stock gapped lower, staged a feeble rally and then proceeded to decline in a waterfall pattern — one that turned into a trip over Niagara Falls, so to speak — after the company revealed that year-end holiday sales growth was less than anticipated (Figure 1). Since then, the stock just can't seem to get a firm footing upon which to arrest the selling pressures and the daily and weekly chart patterns look rather grim for long-term investors in the stock at this time. However, every severe decline eventually ends, and at a price level that begins to attract the interest of the "smart money" in the market. Technicians also watch key "leading edge" support levels to identify beforehand the most logical swing termination/reversal points for a given stock or index. For BBY, now that it has retraced more than 62% of the entire, massive 12-month rally (Nov. '12 to Nov. '13) in less than three months, it's pretty safe to assume that this is a bearish trend reversal and not just a typical, proportional ABC Elliott correction in the context of an ongoing bull market. No, this is a complete reversal, one being driven by the poor earnings and sales results of this popular consumer electronics superstore retailer. Institutional investors were busy scaling out of their BBY positions since May 2013, long before the eventual high was reached six months later; notice the gradual decline in the money flow histogram over that time, even as BBY ground its way ever higher. Yep — the smart money was putting their considerable "smarts" to good use, again, unloading their shares to latecomers who saw nothing but ever increasing valuations for BBY heading into 2014. |
|
| Figure 1. BestBuy's (BBY) downtrend qualifies as a bearish trend reversal and is way more than a proportional correction pattern. The next logical support level is near the Fibonacci support at 79% or 19.00. |
| Graphic provided by: TradeStation. |
| |
| At present, BBY's 89-day Chaikin Money Flow (CMF)(89) histograms is deeply in bearish territory, with no sign yet of bullish accumulation by the big money players in the market. What value investors and technical traders need to watch for before initiating new long positions is this: 1. See if the Fibonacci 76% or 79% retracement level of the prior rally holds back further selling pressures. 2. Look to see if the money flow histogram on at least two time frames (the 34-day and 89-day) confirm that bullish money flow divergences with price are underway. 3. Finally, there needs to be some sort of a panic selling washout and capitulation event followed by a bullish reversal pattern. These things may appear near the 19.00 area on the chart — and they may not, meaning that a full, 100% retracement of the prior rally becomes the next logical price target for BBY. If this happens, there looks to be a ton of support for the stock between 11.20 and 14.00; this will almost surely be an area for the smart money to start accumulating once again, in anticipation of a decent bullish bounce. |
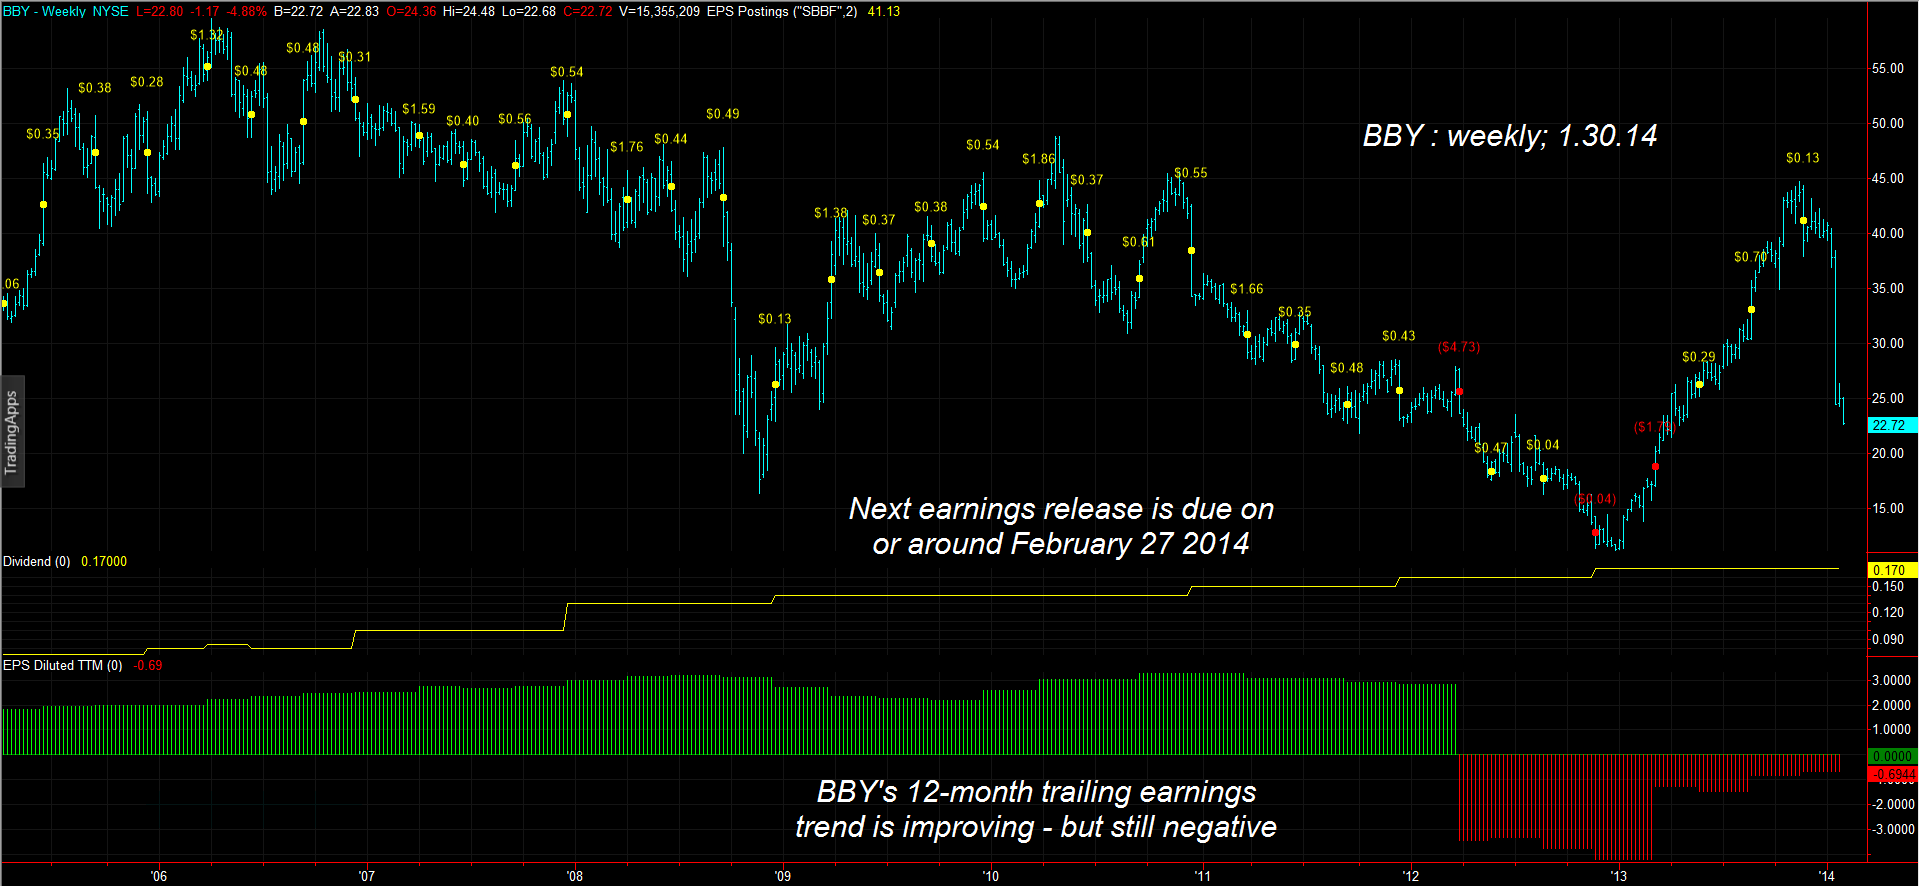
|
| Figure 2. Note that although BBY's trailing earnings trend has improved that it is still negative. |
| Graphic provided by: TradeStation. |
| |
| Aggressive bears might consider putting on a June '13 long $23 put trade here — the odds of more declines down to 19.00 over the next month to six weeks look very good here; this put has lots of time value (slow rate of decay), a good bid/ask spread, and an open interest figure of 731 contracts. Keep your account risk small (less than 1% if possible) on this trade, just in case a short covering rally erupts sooner rather than later and be sure you take profits if you get close to the Fib support areas near 19.00. You could try and hold on for a bigger decline, but for now, the Fib 79% level looks like BBY's most logical target zone. Trade wisely until we meet here again. |
Freelance financial markets writer and online publisher of the Trendzetterz.com S&P 500 Weekly Forecast service.
| Title: | Market consultant and writer |
| Company: | Trendzetterz |
| Address: | 81 Hickory Hollow Drive |
| Crossville, TN 38555 | |
| Phone # for sales: | 904-303-4814 |
| Website: | trendzetterz.com |
| E-mail address: | support@trendzetterz.com |
Traders' Resource Links | |
| Trendzetterz has not added any product or service information to TRADERS' RESOURCE. | |
Click here for more information about our publications!
Comments
Date:�02/12/14Rank:�3Comment:�what is (Fib)

Request Information From Our Sponsors
- StockCharts.com, Inc.
- Candle Patterns
- Candlestick Charting Explained
- Intermarket Technical Analysis
- John Murphy on Chart Analysis
- John Murphy's Chart Pattern Recognition
- John Murphy's Market Message
- MurphyExplainsMarketAnalysis-Intermarket Analysis
- MurphyExplainsMarketAnalysis-Visual Analysis
- StockCharts.com
- Technical Analysis of the Financial Markets
- The Visual Investor
- VectorVest, Inc.
- Executive Premier Workshop
- One-Day Options Course
- OptionsPro
- Retirement Income Workshop
- Sure-Fire Trading Systems (VectorVest, Inc.)
- Trading as a Business Workshop
- VectorVest 7 EOD
- VectorVest 7 RealTime/IntraDay
- VectorVest AutoTester
- VectorVest Educational Services
- VectorVest OnLine
- VectorVest Options Analyzer
- VectorVest ProGraphics v6.0
- VectorVest ProTrader 7
- VectorVest RealTime Derby Tool
- VectorVest Simulator
- VectorVest Variator
- VectorVest Watchdog