HOT TOPICS LIST
- MACD
- Fibonacci
- RSI
- Gann
- ADXR
- Stochastics
- Volume
- Triangles
- Futures
- Cycles
- Volatility
- ZIGZAG
- MESA
- Retracement
- Aroon
INDICATORS LIST
LIST OF TOPICS
PRINT THIS ARTICLE
by Koos van der Merwe
What do you do when a share keeps rising? Do you pick a target and sell or do you ride the trend?
Position: Accumulate
Koos van der Merwe
Has been a technical analyst since 1969, and has worked as a futures and options trader with First Financial Futures in Johannesburg, South Africa.
PRINT THIS ARTICLE
ELLIOTT WAVE
When A Share Goes Up And Up And Up
02/03/14 03:36:17 PMby Koos van der Merwe
What do you do when a share keeps rising? Do you pick a target and sell or do you ride the trend?
Position: Accumulate
| Founded more than 50 years ago as Philips Semiconductors, NXP Semiconductors designs and manufactures high-performance mixed-signal solutions that enable the secure connections to power the automotive, identification, and mobile industries in application areas including wireless infrastructure, lighting, healthcare, industrial, consumer technology, and computing. Their home office is in The Netherlands. |

|
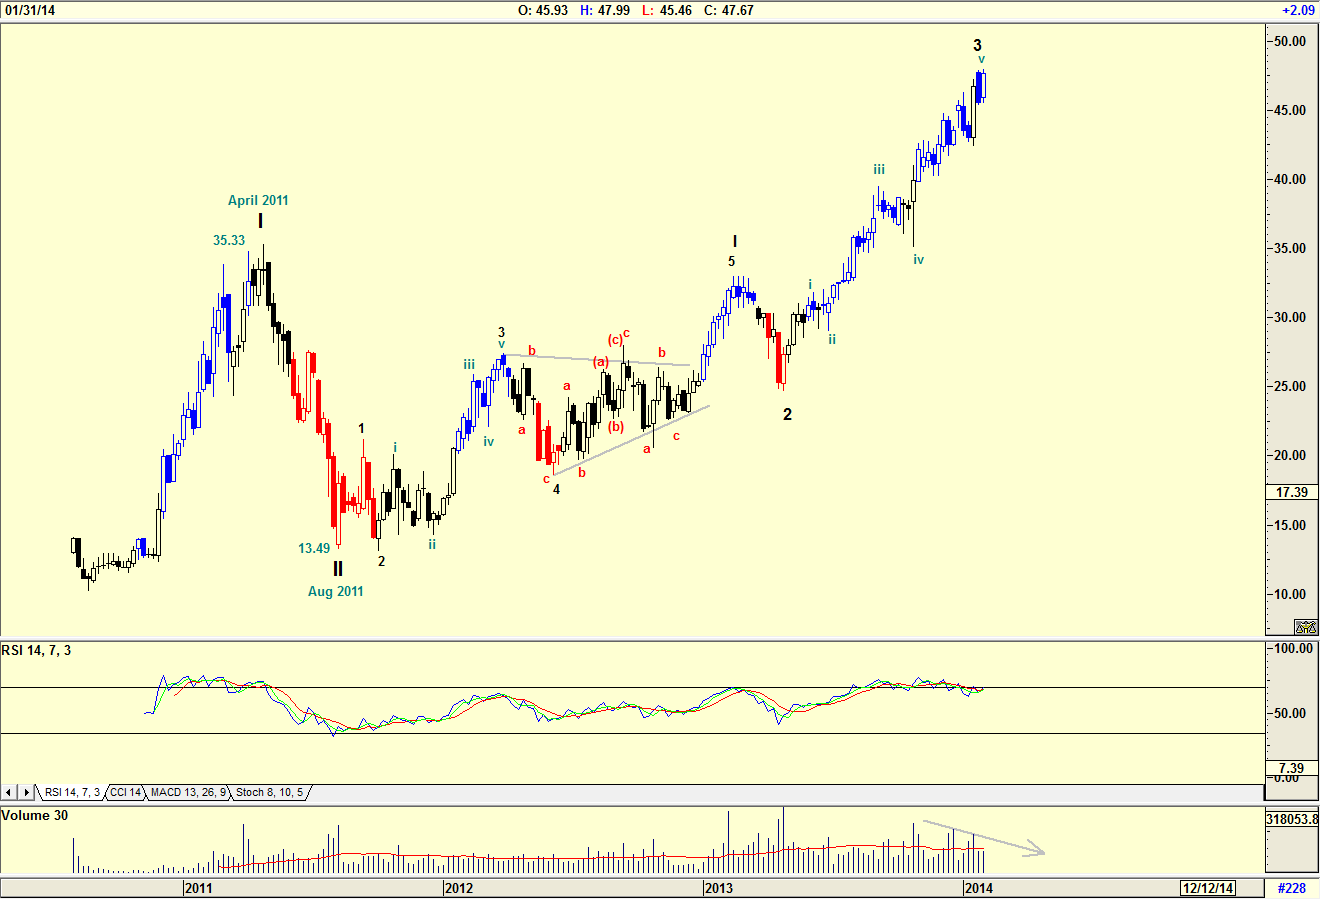
| Figure 1. Weekly chart with the preferred Elliott Wave count. |
| Graphic provided by: AdvancedGET. |
| |
| The chart in Figure 1 is a weekly chart with an Elliott Wave count that could be acceptable. I say, "could be acceptable" because an Elliott Wave count is a signpost in the wilderness, and that sign can change a little way down the road. The wave count is calling for a wave 4 correction, confirmed by the RSI indicator which is suggesting a sell and the volume, which has been falling as the share price has risen. A falling volume with a rising share price suggests weakness. |

|
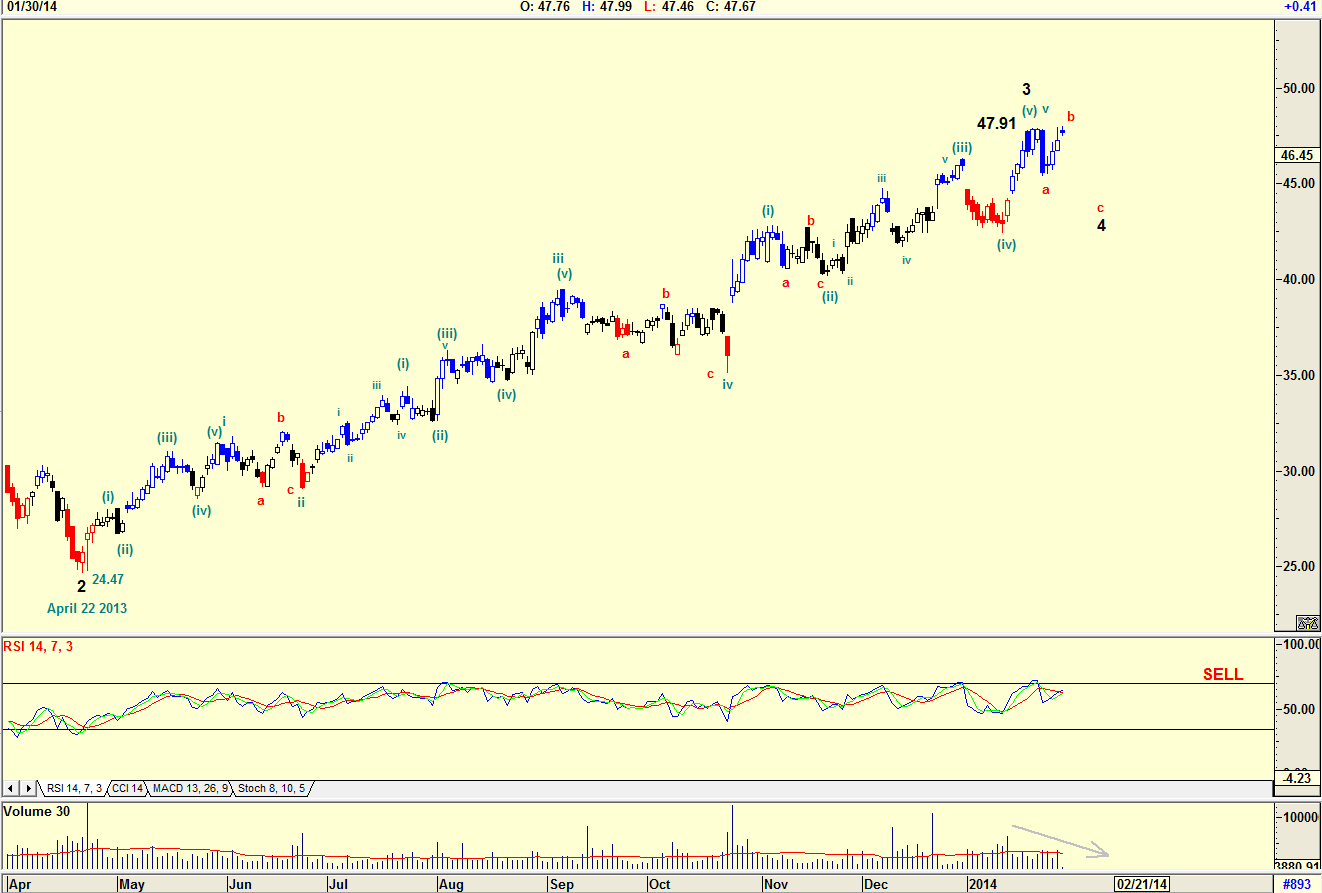
| Figure 2. Daily chart with Elliott Wave count showing a sell signal. |
| Graphic provided by: AdvancedGET. |
| |
| The chart in Figure 2 is a daily chart, confirming the weekly chart with its Elliott Wave count. The chart suggests a Wave 3 top has been completed and that the price should now correct in a Wave 4. Of course the question is, is this truly a Wave 3 top? The retest of the $47.91 level of Wave 3 by wave b of Wave 4 suggests that Wave 3 could go to higher levels, with a more complicated Elliott Wave count. However, the falling volume on the wave b of Wave 4 rise suggests further weakness. To assist in my decision as to what is happening, I looked at Figure 3. |

|
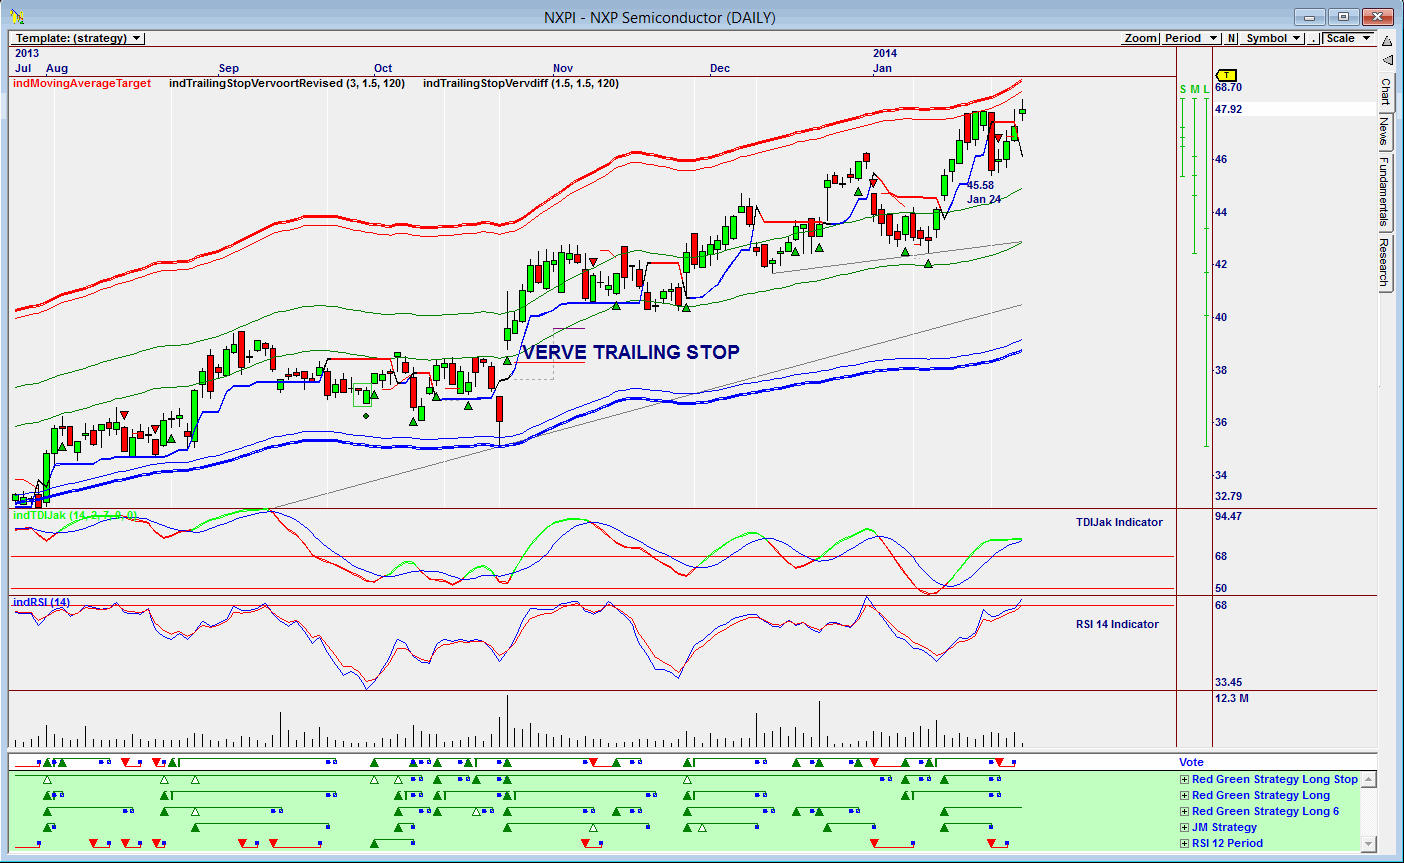
| Figure 3. Omnitrader chart showing doubt as to the sell signal given in Figure 2. |
| Graphic provided by: Omnitrader. |
| |
| Figure 3 is an Omnitrader chart that shows how a sell signal was given on January 24, 2014 as the price broke below the Verve trailing stop. The price immediately reversed, so you would have actually sold as the price moved up, or you would have doubted the sell signal, especially when the price broke above the Verve trailing stop and tested the move above the previous high. Do note on the Vote line how a sell signal was given on January 24, 2014 and then stopped out two days later. At the moment, the Vote line has not suggested a buy signal, even though the Red Green Strategy Long 6 shown in green below the Vote line is in buy mode. Note also that the share price is testing the external upper band, and that the TDIJak indicator looks as though it could soon be giving a sell signal. The RSI indicator is above the 70 horizontal line but has not given a sell signal. I must be honest, I am very biased towards the company Phillips, based in the Netherlands. I have always liked the company, and their products. To find a company related to them does influence my judgement. This is a share that is on my watch list, and as soon as I see a buying opportunity, I will be a buyer. |
Has been a technical analyst since 1969, and has worked as a futures and options trader with First Financial Futures in Johannesburg, South Africa.
| Address: | 3256 West 24th Ave |
| Vancouver, BC | |
| Phone # for sales: | 6042634214 |
| E-mail address: | petroosp@gmail.com |
Click here for more information about our publications!
PRINT THIS ARTICLE

|

Request Information From Our Sponsors
- StockCharts.com, Inc.
- Candle Patterns
- Candlestick Charting Explained
- Intermarket Technical Analysis
- John Murphy on Chart Analysis
- John Murphy's Chart Pattern Recognition
- John Murphy's Market Message
- MurphyExplainsMarketAnalysis-Intermarket Analysis
- MurphyExplainsMarketAnalysis-Visual Analysis
- StockCharts.com
- Technical Analysis of the Financial Markets
- The Visual Investor
- VectorVest, Inc.
- Executive Premier Workshop
- One-Day Options Course
- OptionsPro
- Retirement Income Workshop
- Sure-Fire Trading Systems (VectorVest, Inc.)
- Trading as a Business Workshop
- VectorVest 7 EOD
- VectorVest 7 RealTime/IntraDay
- VectorVest AutoTester
- VectorVest Educational Services
- VectorVest OnLine
- VectorVest Options Analyzer
- VectorVest ProGraphics v6.0
- VectorVest ProTrader 7
- VectorVest RealTime Derby Tool
- VectorVest Simulator
- VectorVest Variator
- VectorVest Watchdog
