

HOT TOPICS LIST
- MACD
- Fibonacci
- RSI
- Gann
- ADXR
- Stochastics
- Volume
- Triangles
- Futures
- Cycles
- Volatility
- ZIGZAG
- MESA
- Retracement
- Aroon
INDICATORS LIST
LIST OF TOPICS
PRINT THIS ARTICLE
by Donald W. Pendergast, Jr.
Down by nearly 25% since July 2013, shares of Target Corp. may be nearing completion of a significant corrective wave pattern.
Position: N/A
Donald W. Pendergast, Jr.
Freelance financial markets writer and online publisher of the Trendzetterz.com S&P 500 Weekly Forecast service.
PRINT THIS ARTICLE
CHART ANALYSIS
TGT: Nearing Swing Price Target?
01/31/14 04:56:10 PMby Donald W. Pendergast, Jr.
Down by nearly 25% since July 2013, shares of Target Corp. may be nearing completion of a significant corrective wave pattern.
Position: N/A
| Even though Target Corp. (TGT) made the news in late 2013 after revealing that customer credit card details had accidentally been hacked, the correction in the stock since July 2013 has been very ordinary and orderly, the type normally encountered after a major run-up in prices. Here's a closer look at the current state of the correction along with some useful price target forecasts for the stock's current downswing. |
|
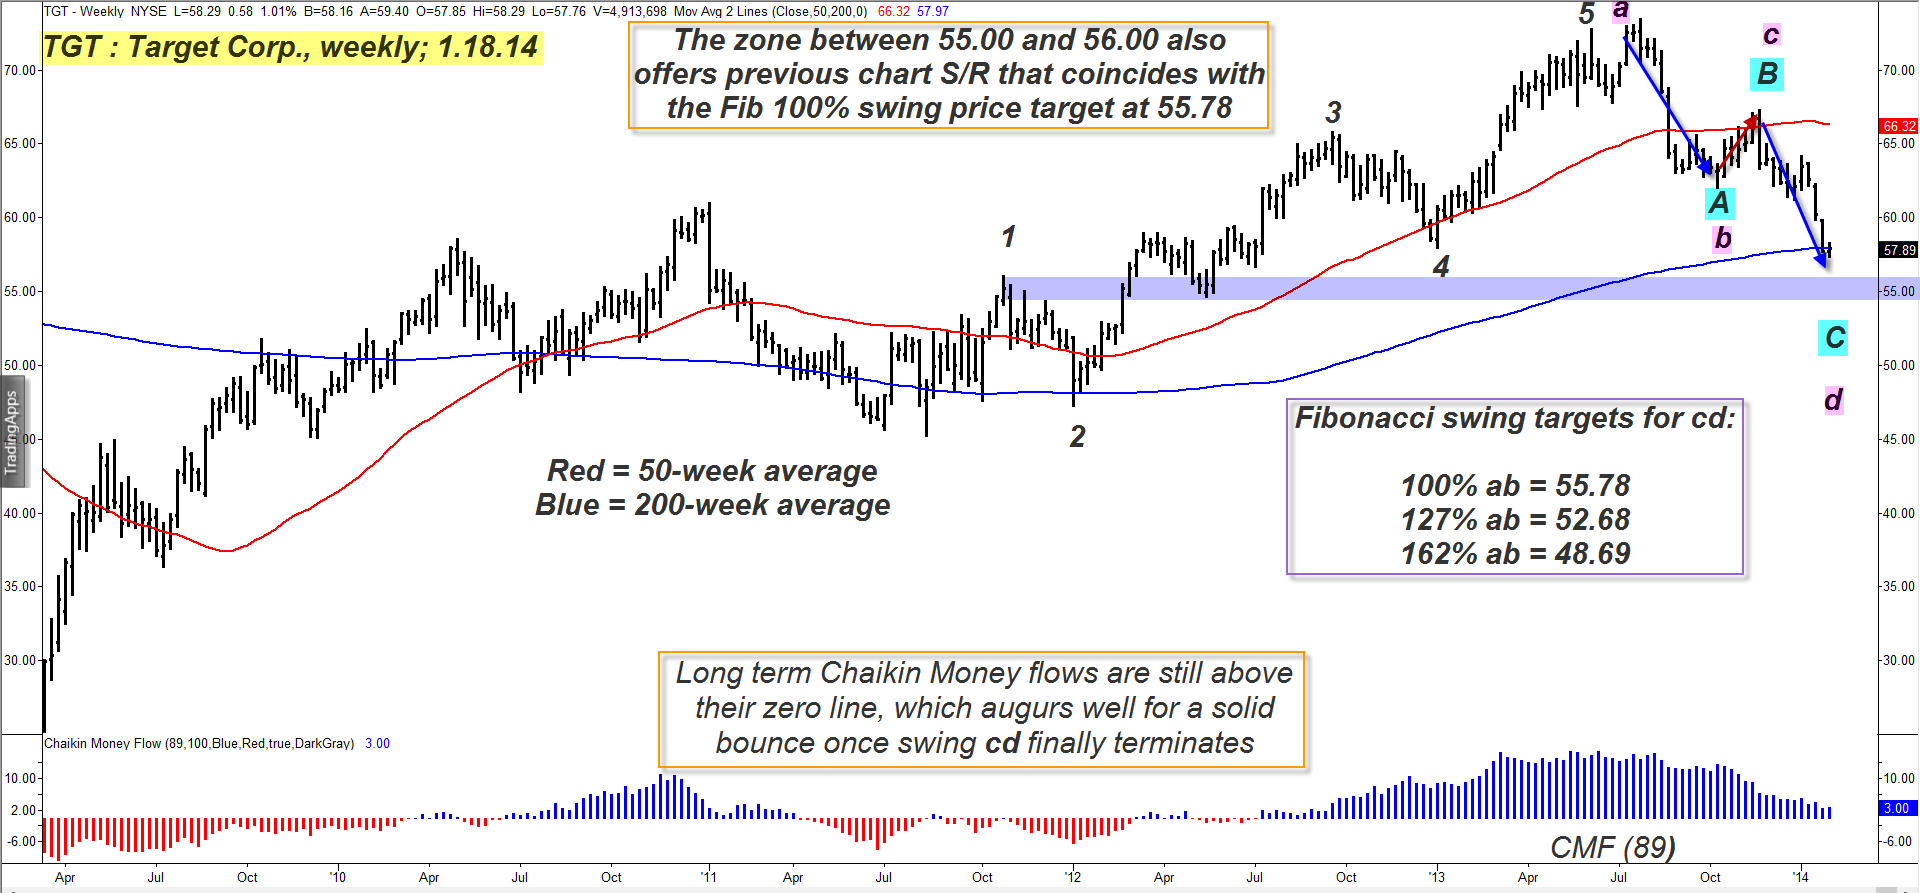
| Figure 1. Target Corp's (TGT) weekly chart offers this beautiful ABC corrective wave pattern; note the Fibonacci-derived target prices for swing cd. |
| Graphic provided by: TradeStation. |
| |
| The weekly price chart of TGT in Figure 2, although not revealing the bigger-picture Elliott Wave patterns at work in the stock (especially on the monthly time frame) does show a fairly straightforward five-wave Elliott rally that ran from August 2011 to July 2013 (see the labels for swings 1 to 5); after peaking out last summer, an equally clear ABC corrective wave pattern has formed, one that is in proportion to the previous rally. As Elliott Wave practitioners know, the concept of proportionality is a critical aspect of determining accurate wave counts and price forecasts, and this particular ABC pattern looks "right on" in terms of price/time ratios. That's all well and good, but how can we apply this knowledge in a useful way that can perhaps alert existing TGT shorts when they might want/need to take partial or full profits and also alert bulls when the latest swing has likely terminated, just prior to a significant tradable reversal? Since we already know that a beautiful, well-proportioned ABC correction is underway, a simple and highly effective price forecasting method is to use an AB=CD swing ratio formula to project logical swing termination price zones for the current swing cd. If we label the July '13 high as 'a', the next major swing low as 'b', the next rally as 'c' all we need to do is measure the length of swing ab and then apply various Fibonacci multiples to that amount to project useful (and often accurate) price targets for swing cd. |
|
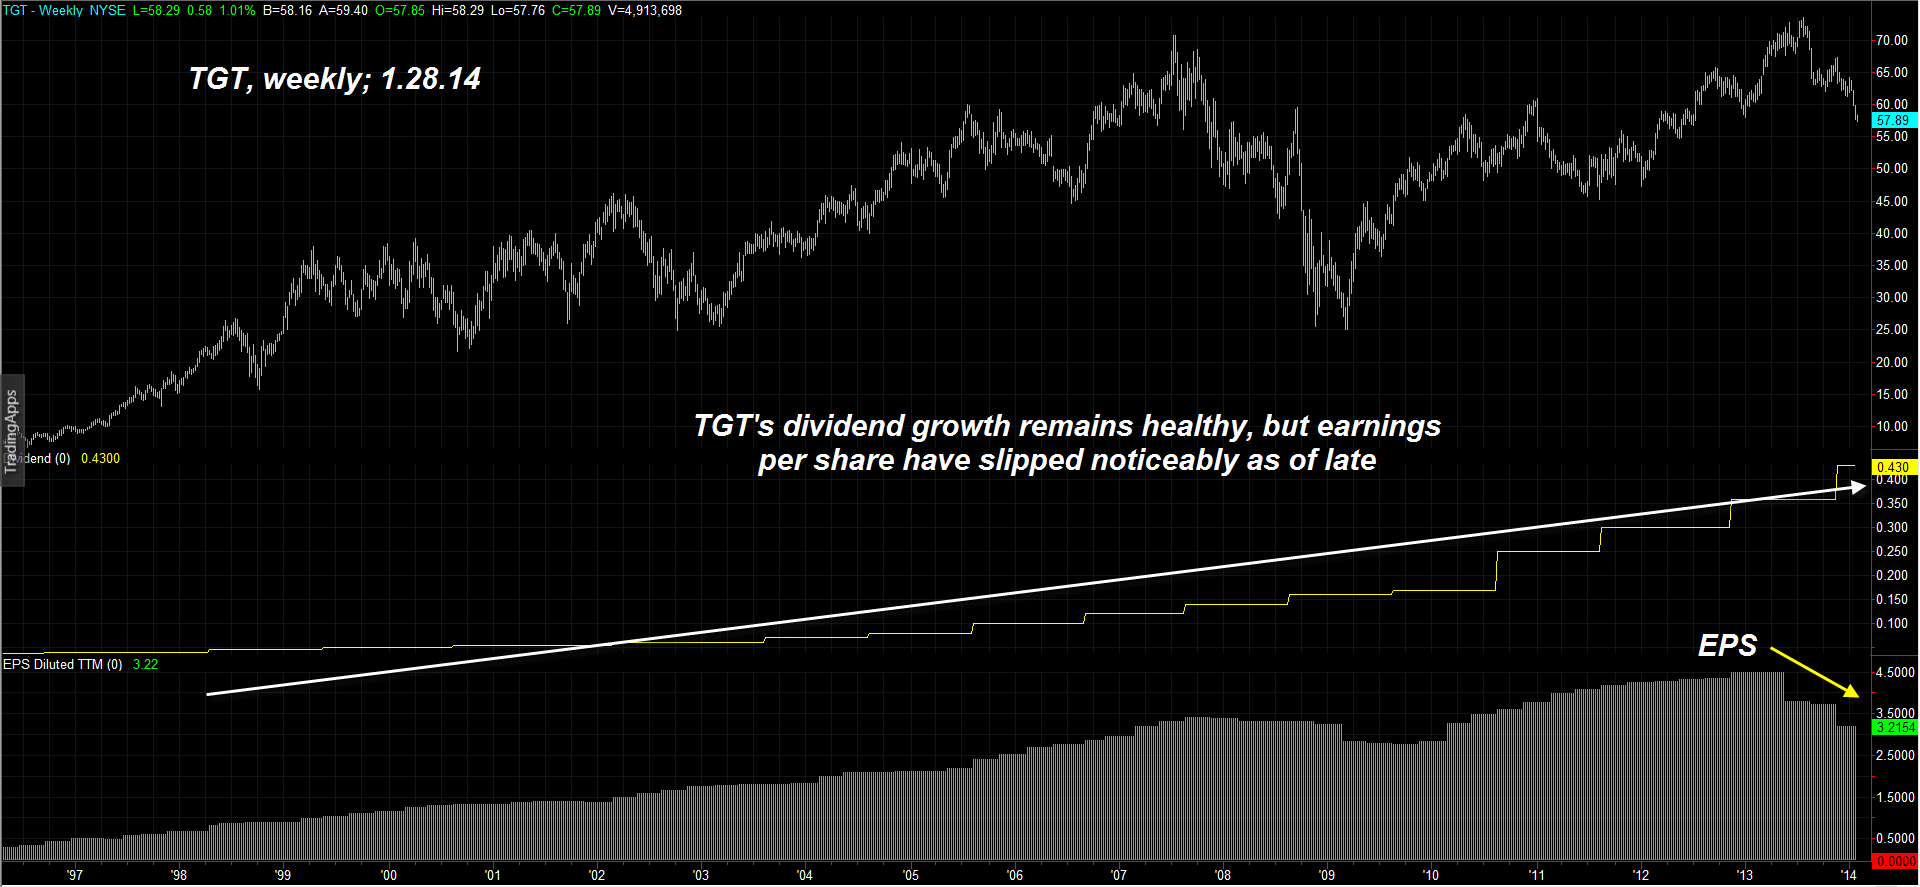
| Figure 2. TGT's long term dividend growth trend remains strong but its earnings per share trend is moving lower. |
| Graphic provided by: TradeStation. |
| Graphic provided by: TradeStation RadarScreen. |
| |
| Basically, the standard formula for well-proportioned swing moves we'll use here is: 1. ab=cd 2. ab=cd*1.27 3. ab=cd*1.62 These are the most common Fibonacci swing ratios used for projecting where a cd swing will terminate, and if we apply this formula to this weekly chart of TGT we get these target prices: 1. 55.78 2. 52.68 3. 48.69 Now, TGT still has plenty of bearish momentum behind it now, so the first target should be hit fairly soon. Note the violet support zone between 55.00 and 56.00 which also coincides with the upper swing target at 55.78; this could be a rather strong support zone and traders should look at daily charts to see if a valid bullish reversal has manifested after hitting that general area. TGT is also trading beneath its 200-week moving average now, which is another bearish omen. Now, if the broad markets keep getting hammered as TGT hits that first target area, the odds increase that the Fibonacci 127% swing target at 52.68 will also be hit in relatively short order. This should also be a strong support zone, as is the "last ditch" support at 48.69. Really, no one knows how far down TGT will descend before making a solid bullish reversal, but the price targets here are the best forecasting numbers to help confirm valid bullish reversal zones in the days and weeks ahead. Those who are short TGT should monitor their positions closely as any/all of these targets are hit, in order to protect themselves from a nasty, profit-killing short-covering rally. The first half of 2014 should see plenty more downside in the major US stock indexes, so check your charts to look for these kinds of ABC patterns now — if you can find stocks just getting ready to head south on a big C wave, your profits could be large. Remember to keep your trade risks modest and to trade wisely until we meet here again. |
Freelance financial markets writer and online publisher of the Trendzetterz.com S&P 500 Weekly Forecast service.
| Title: | Market consultant and writer |
| Company: | Trendzetterz |
| Address: | 81 Hickory Hollow Drive |
| Crossville, TN 38555 | |
| Phone # for sales: | 904-303-4814 |
| Website: | trendzetterz.com |
| E-mail address: | support@trendzetterz.com |
Traders' Resource Links | |
| Trendzetterz has not added any product or service information to TRADERS' RESOURCE. | |
Click here for more information about our publications!
Comments

Request Information From Our Sponsors
- StockCharts.com, Inc.
- Candle Patterns
- Candlestick Charting Explained
- Intermarket Technical Analysis
- John Murphy on Chart Analysis
- John Murphy's Chart Pattern Recognition
- John Murphy's Market Message
- MurphyExplainsMarketAnalysis-Intermarket Analysis
- MurphyExplainsMarketAnalysis-Visual Analysis
- StockCharts.com
- Technical Analysis of the Financial Markets
- The Visual Investor
- VectorVest, Inc.
- Executive Premier Workshop
- One-Day Options Course
- OptionsPro
- Retirement Income Workshop
- Sure-Fire Trading Systems (VectorVest, Inc.)
- Trading as a Business Workshop
- VectorVest 7 EOD
- VectorVest 7 RealTime/IntraDay
- VectorVest AutoTester
- VectorVest Educational Services
- VectorVest OnLine
- VectorVest Options Analyzer
- VectorVest ProGraphics v6.0
- VectorVest ProTrader 7
- VectorVest RealTime Derby Tool
- VectorVest Simulator
- VectorVest Variator
- VectorVest Watchdog