

HOT TOPICS LIST
- MACD
- Fibonacci
- RSI
- Gann
- ADXR
- Stochastics
- Volume
- Triangles
- Futures
- Cycles
- Volatility
- ZIGZAG
- MESA
- Retracement
- Aroon
INDICATORS LIST
LIST OF TOPICS
PRINT THIS ARTICLE
by Donald W. Pendergast, Jr.
Now that FedEx shares have put in a major high, the big question now is to determine where the next major support levels are.
Position: N/A
Donald W. Pendergast, Jr.
Freelance financial markets writer and online publisher of the Trendzetterz.com S&P 500 Weekly Forecast service.
PRINT THIS ARTICLE
SUPPORT & RESISTANCE
FedEx: Will Its Current Support Level Hold?
01/30/14 11:57:52 AMby Donald W. Pendergast, Jr.
Now that FedEx shares have put in a major high, the big question now is to determine where the next major support levels are.
Position: N/A
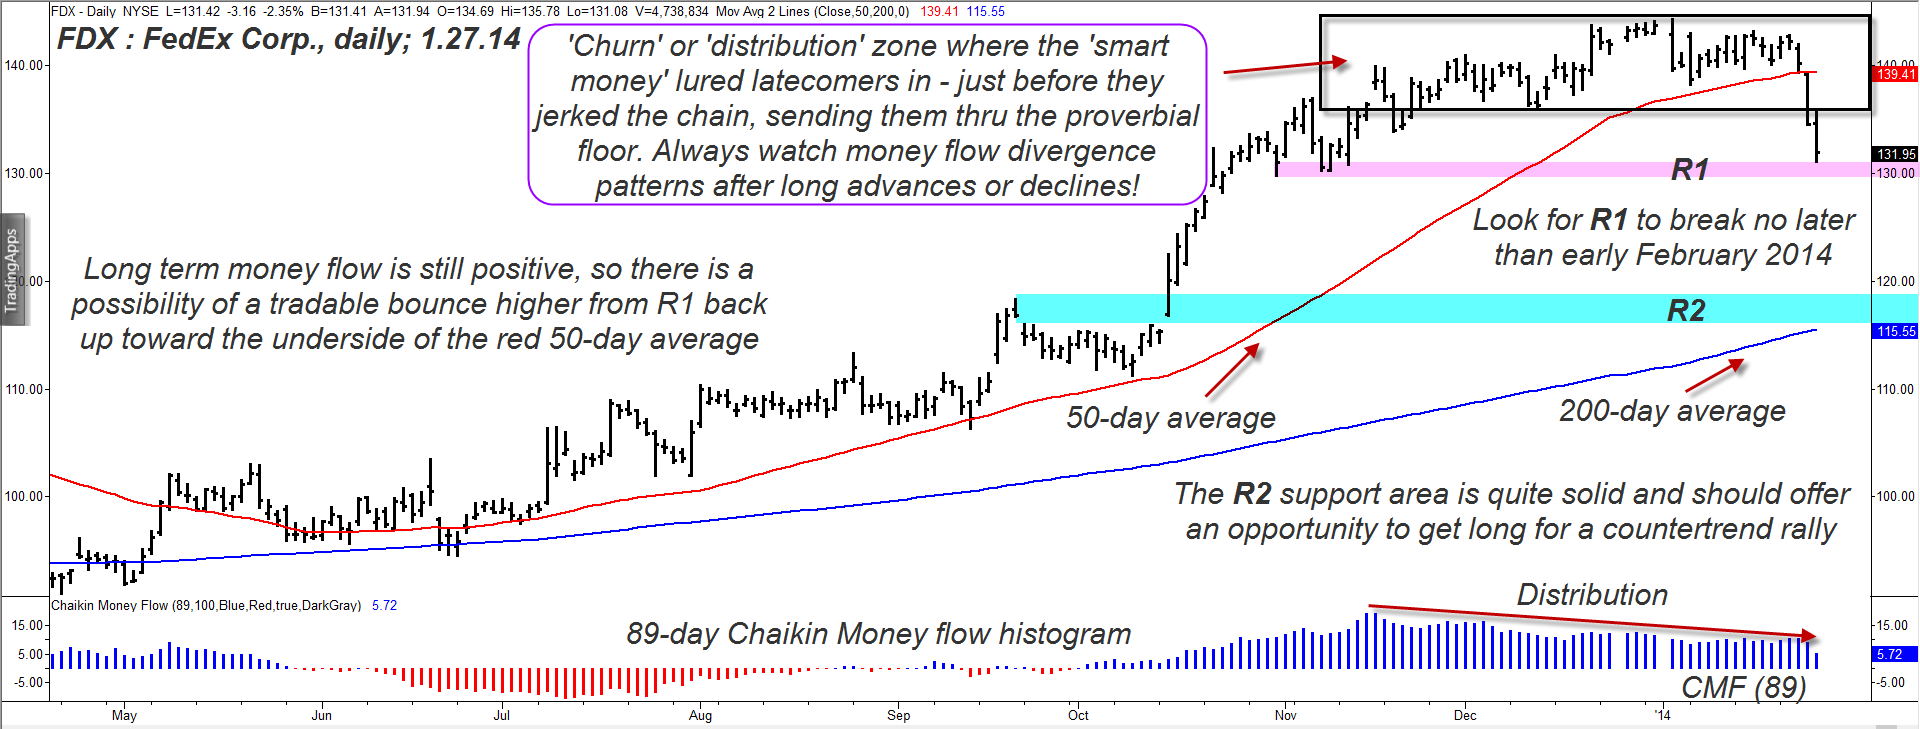
| Now that the so-called "smart money" has picked the pockets of latecomers to the recent FedEx (FDX) rally — yet again — will its current support level provide an opportunity for a tradable bounce, or not? During the final phase of a large bull run in a stock, the smart money is busy distributing shares to the lesser informed; you can see the depiction of this by looking at the black rectangle at the top of the recent high (Figure 1) and then by viewing the money flow histogram at the bottom of the chart; as FDX churned in a sideways funk between early November 2013 and early January 2014, the smart money (big mutual funds, hedge funds, and wealthy investors) were busy forking over their shares in the stock to starry-eyed latecomers who believed that FDX could only travel in one direction — higher. Sadly, this almost never happens — at least not at the end of a mega rally like this one, a rally that saw FDX gain nearly 60% in 8 1/2 months (nearly 7% per month). Once this two-month distribution stage completed, the smart money folks turned the tables and decided to do some shorting, which then triggered the latecomers to dump their recently acquired shares, too. This caused the sharp declines we've seen over the past three trading sessions. That, dear readers, is the reality of how market tops form before large corrections occur. You don't control the market with your systems, indicators or fundamental forecasts, even though all are wonderful, highly useful tools in themselves. No, the big money folks control all liquid stock markets and they are the ones who initiate every single reversal, trend, continuation move or fake-out move. Period. As intelligent traders and investors, we need to follow their lead instead of trying to stand in their way, becoming their next stock market road kill meal, haha. |
|
| Figure 1. FedEx Corp.(FDX) exhibits a near-textbook quality distribution pattern on its daily time frame, just prior to a swift, sharp decline. Support near R2 appears to be more substantial than that at R1. |
| Graphic provided by: TradeStation. |
| |
| Right now, the best way to follow the leader, so to speak, is to locate the next logical support zones for FDX; I have labeled them for you as R1 and R2, respectively. R1 (near 130.00) has essentially been reached, but it would not be surprising to see the stock dip into the upper 120s before attempting to reverse; given the heavy bearish momentum, however, odds are that any such bounce from R1 will be fairly timid and will likely stall short of the underside of the red 50-day moving average. Should that scenario play out as expected, look for the subsequent decline down toward R2 to be fairly sharp and swift, as many C-wave corrective patterns are wont to be. In fact, if you see a clear reversal pattern after a bounce from R1, look to go short there in anticipation of a decline toward R2. Use a two-to-three bar trailing stop of the daily highs to manage the trade and look to take at least half profits once 118.00 to 120.00 is hit. More aggressive traders may choose to hang on for a drop toward 115.00 but only if they are able to monitor their positions in real-time to avoid getting clobbered by a sudden short-covering rally. Keep trade risks at 1% of account value and also keep an eye on the price action in the major US stock indexes, too, as many stocks are also in A-wave or C-wave corrective waves now. Trade wisely until we meet here again. |
|
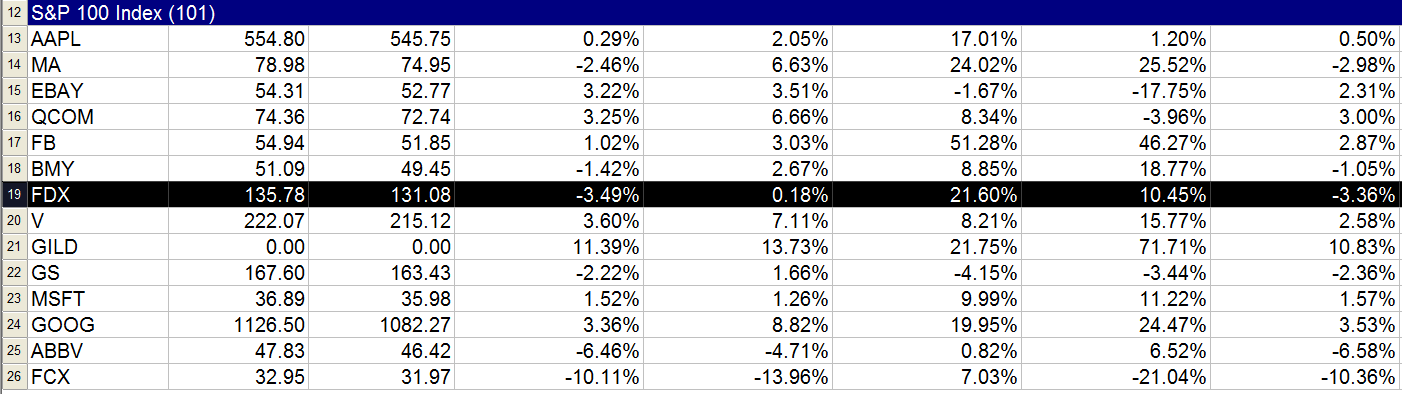
| Figure 2. FDX has only recently begun to underperform the S&P 500 index (.SPX) over the past 4 weeks; it is still outperforming the index over the past 13-, 26- and 52-week periods, however. |
| Graphic provided by: TradeStation. |
| Graphic provided by: TradeStation RadarScreen. |
| |
Freelance financial markets writer and online publisher of the Trendzetterz.com S&P 500 Weekly Forecast service.
| Title: | Market consultant and writer |
| Company: | Trendzetterz |
| Address: | 81 Hickory Hollow Drive |
| Crossville, TN 38555 | |
| Phone # for sales: | 904-303-4814 |
| Website: | trendzetterz.com |
| E-mail address: | support@trendzetterz.com |
Traders' Resource Links | |
| Trendzetterz has not added any product or service information to TRADERS' RESOURCE. | |
Click here for more information about our publications!
PRINT THIS ARTICLE

Request Information From Our Sponsors
- StockCharts.com, Inc.
- Candle Patterns
- Candlestick Charting Explained
- Intermarket Technical Analysis
- John Murphy on Chart Analysis
- John Murphy's Chart Pattern Recognition
- John Murphy's Market Message
- MurphyExplainsMarketAnalysis-Intermarket Analysis
- MurphyExplainsMarketAnalysis-Visual Analysis
- StockCharts.com
- Technical Analysis of the Financial Markets
- The Visual Investor
- VectorVest, Inc.
- Executive Premier Workshop
- One-Day Options Course
- OptionsPro
- Retirement Income Workshop
- Sure-Fire Trading Systems (VectorVest, Inc.)
- Trading as a Business Workshop
- VectorVest 7 EOD
- VectorVest 7 RealTime/IntraDay
- VectorVest AutoTester
- VectorVest Educational Services
- VectorVest OnLine
- VectorVest Options Analyzer
- VectorVest ProGraphics v6.0
- VectorVest ProTrader 7
- VectorVest RealTime Derby Tool
- VectorVest Simulator
- VectorVest Variator
- VectorVest Watchdog