

HOT TOPICS LIST
- MACD
- Fibonacci
- RSI
- Gann
- ADXR
- Stochastics
- Volume
- Triangles
- Futures
- Cycles
- Volatility
- ZIGZAG
- MESA
- Retracement
- Aroon
INDICATORS LIST
LIST OF TOPICS
PRINT THIS ARTICLE
by Donald W. Pendergast, Jr.
Now at an important AB=CD price target, will shares of National Oilwell Varco be able to regain some of their recent decline?
Position: N/A
Donald W. Pendergast, Jr.
Freelance financial markets writer and online publisher of the Trendzetterz.com S&P 500 Weekly Forecast service.
PRINT THIS ARTICLE
SUPPORT & RESISTANCE
NOV: Major Support Test
01/28/14 05:10:09 PMby Donald W. Pendergast, Jr.
Now at an important AB=CD price target, will shares of National Oilwell Varco be able to regain some of their recent decline?
Position: N/A
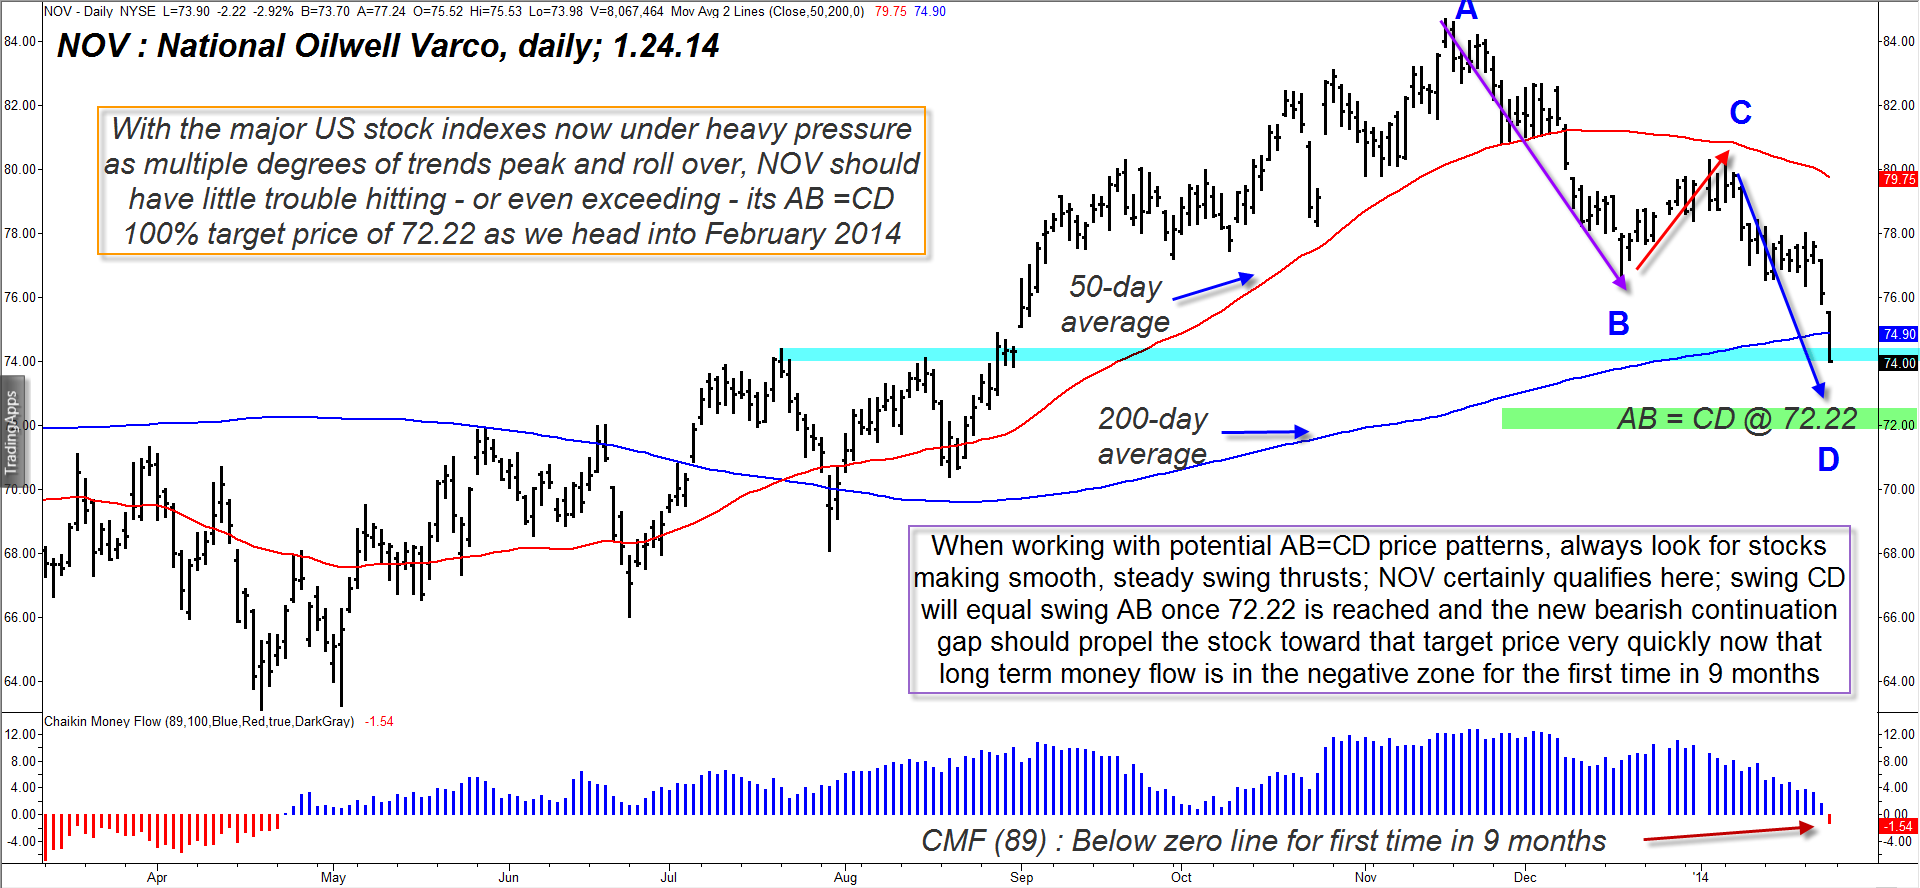
| Since peaking at the end of a large scale rally in mid-November 2013, shares of National Oilwell Varco (NOV) have traced out a very symmetrical ABC corrective wave pattern, one that could be very close to a nominal price completion target. However, there are a variety of technical factors at work on the stock's daily chart that suggest that the current C wave may have a bit more downside left in it before a tradable rally will ensue. Here's a closer look now. |
|
| Figure 1. National Oilwell Varco's (NOV) beautiful AB=CD price pattern is quickly closing in on its 100& price target of 72.22. Additional CD swing price targets are at 70.02 and 67.18. |
| Graphic provided by: TradeStation. |
| |
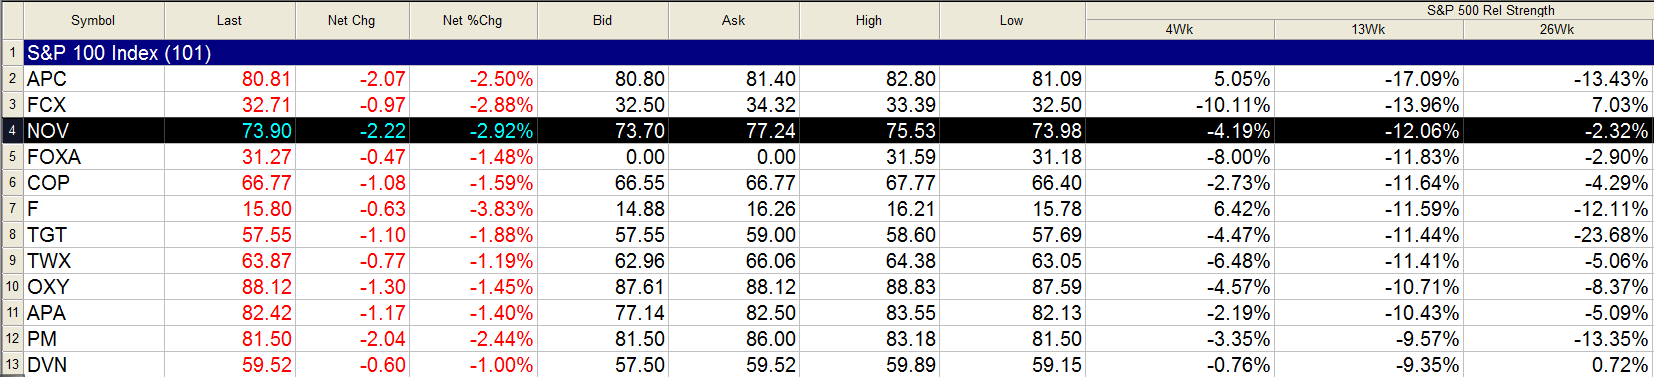
| With so many large cap stocks now forming similar price patterns, a chartist's job of identifying high probability trading setups becomes much easier, especially when the stocks are in deep corrections that are approaching critical price support levels. One such stock is National Oilwell Varco (NOV), an oil services industry group issue with a large institutional following; the stock is currently tracing out a beautiful AB = CD swing pattern (which is also part of an Elliott Wave ABC corrective move) that is rapidly approaching its 100% price target for swing CD. While NOV is at an important support level right now — one formed by several previous swing highs near the 74.00 level — this level is not likely to hold much longer because of the following technical dynamics: 1. NOV has just made a bearish continuation move gap; these typically mean more downside, especially with a weak relative strength stock like this one; note that NOV is underperforming the .SPX over the past 4-, 13-, 26- and 52-week periods. 2. NOV has sliced right through its 200-day simple moving average (sma) in conjunction with the bearish price gap move. 3. The developing AB=CD price pattern has only another 1.78 points of downside to reach the point where swing AB = swing CD, and that will occur at 72.22. With such negative momentum at work in NOV now, that target should be hit relatively quickly. 4. Long term money flow [based on the 89-day Chaikin Money flow histogram (CMF)(89)] has just dipped below its zero line for the first time in more than 9 months, indicating that the "smart money" are not big buyers of this stock — yet. |
|
| Figure 2. NOV has been underperforming the S&P 500 index (.SPX) over the past 4-, 13-, 26- and 52-week periods. |
| Graphic provided by: TradeStation. |
| Graphic provided by: TradeStation RadarScreen. |
| |
| Here are the major price targets at which swing CD is most likely to complete: a. 100% of AB = 72.22 b. 127% of AB = 70.02 c. 162% of AB = 67.18 These are general guidelines, but if you see significant bullish reversal patterns occur near any of these price zones you may be able to better time a good bullish bounce. The bounce could be substantial if there is a lot of short covering activity as the smart money begins to get back into the stock, wiping out late coming short sellers. NOV can be shorted with small amounts of risk capital on a decline below 73.98, but you need to be really nimble just in case a short covering rally erupts before the 100% target at 72.22 is hit. It's much safer to simply let NOV's current decline play out and then jump back in on the long side once any of the key targets are reached and solid reversal patterns begin forming. Try to keep your account risk at about 1% if going this route and be sure to take at least half profits on your first solid bounce higher after entry. Trade wisely until we meet here again. |
Freelance financial markets writer and online publisher of the Trendzetterz.com S&P 500 Weekly Forecast service.
| Title: | Market consultant and writer |
| Company: | Trendzetterz |
| Address: | 81 Hickory Hollow Drive |
| Crossville, TN 38555 | |
| Phone # for sales: | 904-303-4814 |
| Website: | trendzetterz.com |
| E-mail address: | support@trendzetterz.com |
Traders' Resource Links | |
| Trendzetterz has not added any product or service information to TRADERS' RESOURCE. | |
Click here for more information about our publications!
PRINT THIS ARTICLE

Request Information From Our Sponsors
- VectorVest, Inc.
- Executive Premier Workshop
- One-Day Options Course
- OptionsPro
- Retirement Income Workshop
- Sure-Fire Trading Systems (VectorVest, Inc.)
- Trading as a Business Workshop
- VectorVest 7 EOD
- VectorVest 7 RealTime/IntraDay
- VectorVest AutoTester
- VectorVest Educational Services
- VectorVest OnLine
- VectorVest Options Analyzer
- VectorVest ProGraphics v6.0
- VectorVest ProTrader 7
- VectorVest RealTime Derby Tool
- VectorVest Simulator
- VectorVest Variator
- VectorVest Watchdog
- StockCharts.com, Inc.
- Candle Patterns
- Candlestick Charting Explained
- Intermarket Technical Analysis
- John Murphy on Chart Analysis
- John Murphy's Chart Pattern Recognition
- John Murphy's Market Message
- MurphyExplainsMarketAnalysis-Intermarket Analysis
- MurphyExplainsMarketAnalysis-Visual Analysis
- StockCharts.com
- Technical Analysis of the Financial Markets
- The Visual Investor