HOT TOPICS LIST
- MACD
- Fibonacci
- RSI
- Gann
- ADXR
- Stochastics
- Volume
- Triangles
- Futures
- Cycles
- Volatility
- ZIGZAG
- MESA
- Retracement
- Aroon
INDICATORS LIST
LIST OF TOPICS
PRINT THIS ARTICLE
by David Penn
The June rally in sugar resumes in September.
Position: N/A
David Penn
Technical Writer for Technical Analysis of STOCKS & COMMODITIES magazine, Working-Money.com, and Traders.com Advantage.
PRINT THIS ARTICLE
TRITOP/TRI BOTTOM
March Sugar's Triple Bottom
10/04/02 01:49:12 PMby David Penn
The June rally in sugar resumes in September.
Position: N/A
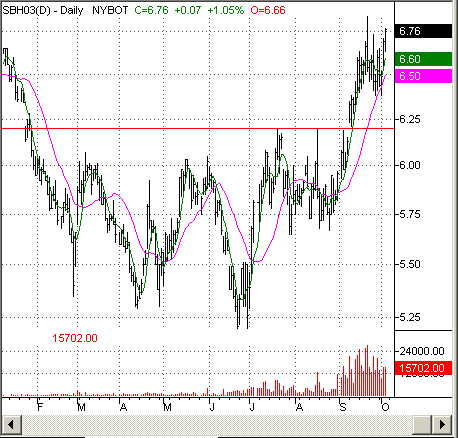
| Sugar prices have been forming a base of sorts for months, particularly, since sugar prices fell into a range between 525 and 620 in March 2002. For the next six months, sugar (as measured by the March 2003 futures contract) oscillated between those resistance and support levels, threatening to break out on the upside in July and again in August. Yet on each occasion, resistance in the area of 620 held fast, preventing March sugar from gaining and keeping higher ground. |
| The March through August churning also featured three distinct bottoms: the initial decline to 535 at the end of February, the "double-dip" declines in April that took March sugar to 530, and the somewhat deeper declines of late June, which saw March sugar reach a low of 520. These bottom troughs have traced out a triple bottom formation in March sugar, a formation from which sugar prices appear to be breaking in September--after escaping the late July/early August price congestion that threatened to bog down any breakout rally. |

|
| Three distinct troughs carve out a triple bottom in March sugar. |
| Graphic provided by: TradeStation. |
| |
| That "bogging down" appears not to have occurred, as prices broke from the highest point in the formation at about 620 and reached a high of 685 before consolidating (a gain of about $730 per contract). What is particularly appealing from the bullish perspective is the fact that the September consolidation in March sugar should provide for stout support should prices slip and correct some before continuing to move upward. The size of the triple bottom formation (value at the lowest point in the formation subtracted from the value at the highest point) is 95 points which, when added to the value at the highest point of the formation, suggests an immediate upside price target of 715. |
Technical Writer for Technical Analysis of STOCKS & COMMODITIES magazine, Working-Money.com, and Traders.com Advantage.
| Title: | Technical Writer |
| Company: | Technical Analysis, Inc. |
| Address: | 4757 California Avenue SW |
| Seattle, WA 98116 | |
| Phone # for sales: | 206 938 0570 |
| Fax: | 206 938 1307 |
| Website: | www.Traders.com |
| E-mail address: | DPenn@traders.com |
Traders' Resource Links | |
| Charting the Stock Market: The Wyckoff Method -- Books | |
| Working-Money.com -- Online Trading Services | |
| Traders.com Advantage -- Online Trading Services | |
| Technical Analysis of Stocks & Commodities -- Publications and Newsletters | |
| Working Money, at Working-Money.com -- Publications and Newsletters | |
| Traders.com Advantage -- Publications and Newsletters | |
| Professional Traders Starter Kit -- Software | |
Click here for more information about our publications!
PRINT THIS ARTICLE

Request Information From Our Sponsors
- StockCharts.com, Inc.
- Candle Patterns
- Candlestick Charting Explained
- Intermarket Technical Analysis
- John Murphy on Chart Analysis
- John Murphy's Chart Pattern Recognition
- John Murphy's Market Message
- MurphyExplainsMarketAnalysis-Intermarket Analysis
- MurphyExplainsMarketAnalysis-Visual Analysis
- StockCharts.com
- Technical Analysis of the Financial Markets
- The Visual Investor
- VectorVest, Inc.
- Executive Premier Workshop
- One-Day Options Course
- OptionsPro
- Retirement Income Workshop
- Sure-Fire Trading Systems (VectorVest, Inc.)
- Trading as a Business Workshop
- VectorVest 7 EOD
- VectorVest 7 RealTime/IntraDay
- VectorVest AutoTester
- VectorVest Educational Services
- VectorVest OnLine
- VectorVest Options Analyzer
- VectorVest ProGraphics v6.0
- VectorVest ProTrader 7
- VectorVest RealTime Derby Tool
- VectorVest Simulator
- VectorVest Variator
- VectorVest Watchdog
