

HOT TOPICS LIST
- MACD
- Fibonacci
- RSI
- Gann
- ADXR
- Stochastics
- Volume
- Triangles
- Futures
- Cycles
- Volatility
- ZIGZAG
- MESA
- Retracement
- Aroon
INDICATORS LIST
LIST OF TOPICS
PRINT THIS ARTICLE
by Donald W. Pendergast, Jr.
Hewlett Packard common shares rose by more than 180% between November 2012 and January 2014, but the smart money seems to have bailed out of the stock since the spring of 2013.
Position: N/A
Donald W. Pendergast, Jr.
Freelance financial markets writer and online publisher of the Trendzetterz.com S&P 500 Weekly Forecast service.
PRINT THIS ARTICLE
SUPPORT & RESISTANCE
HPQ: Looking Vulnerable Near Key Resistance
01/24/14 04:49:38 PMby Donald W. Pendergast, Jr.
Hewlett Packard common shares rose by more than 180% between November 2012 and January 2014, but the smart money seems to have bailed out of the stock since the spring of 2013.
Position: N/A
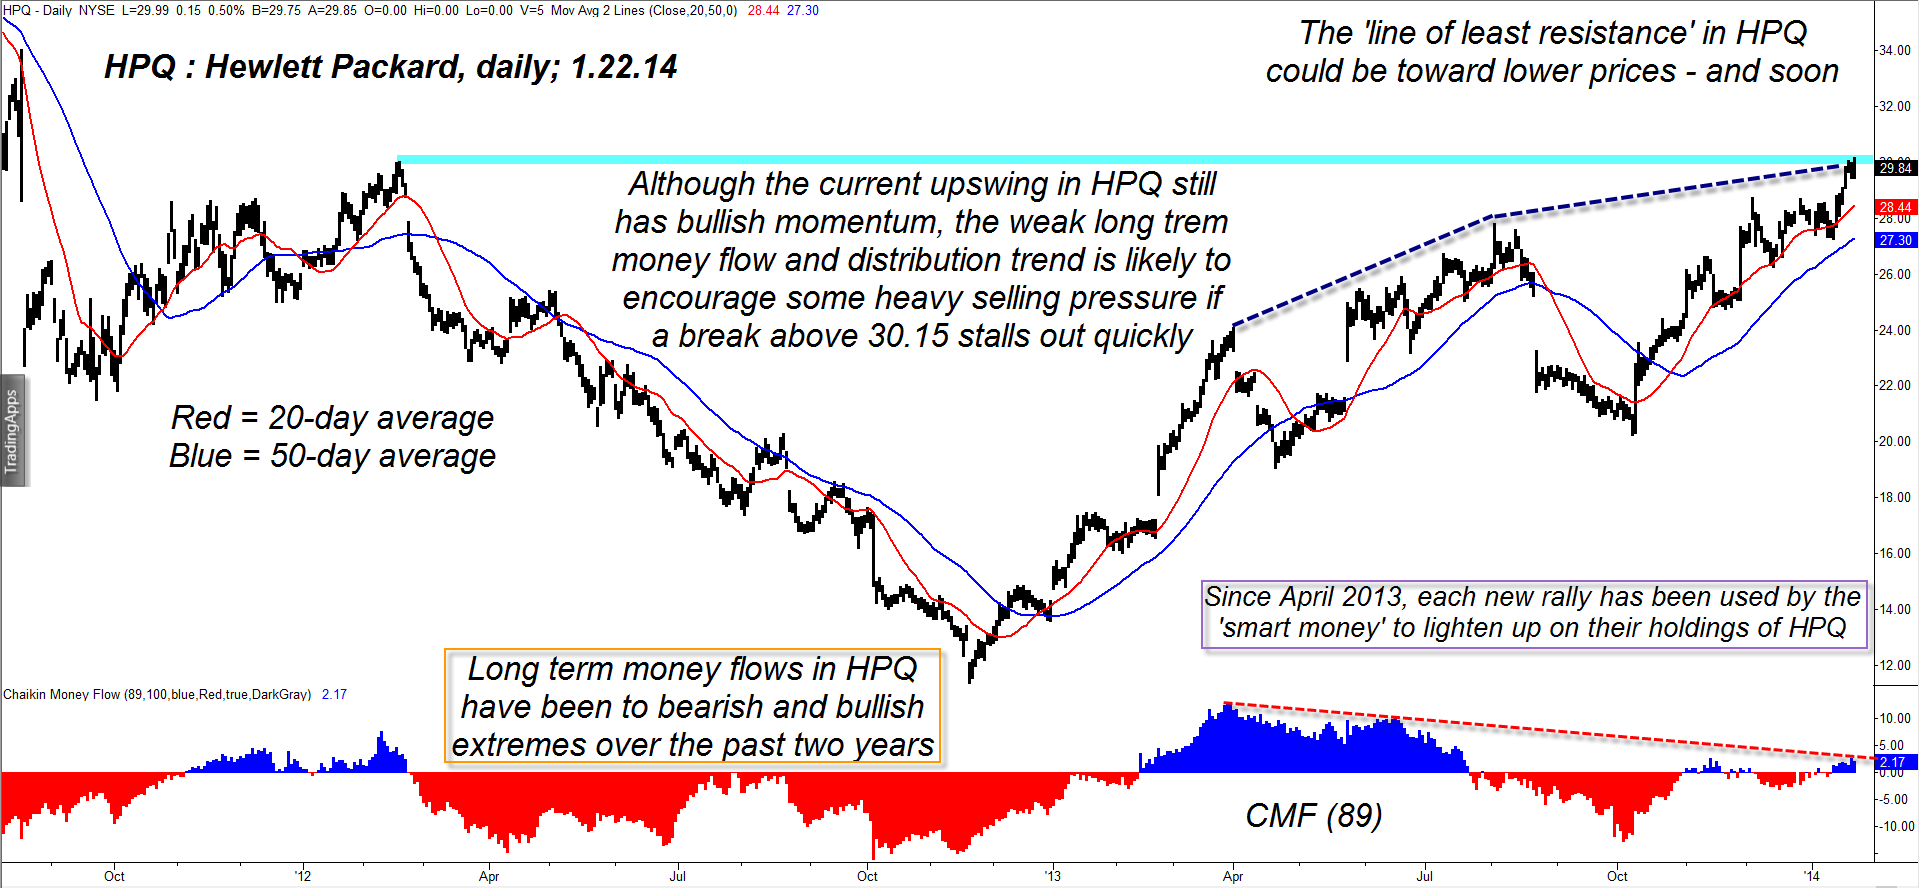
| Shares of Hewlett Packard (HPQ) rose by more than 180% between November 2012 and January 2014, but the smart money seems to have bailed out of the stock during its past two rallies; given that the stock is still technically in a long-term bear market. HPQ's latest pause near a key technical resistance level near 30.00 could be an early warning of an impending trend change. Here's a closer look now. |
|
| Figure 1. Hewlett Packard (HPQ) has traced out a sloppy 5-wave impulse pattern during its bear market rally of the past 14 months; with the stock near a key resistance level as the long-term money flow histogram confirms major distribution since April 2013, the odds are that HPQ will selloff in the near future. |
| Graphic provided by: TradeStation. |
| |
| HPQ's decline during 2010-2012 was extremely harsh for its long-term shareholders; with the stock losing nearly 80% of its value during a 31-month rout (Figure 1). Fears over the future of home PC and notebook computer sales hit HPQ (and DELL) share prices hard during that time, but a bear market rally since late 2012 has helped boost share prices up from such rock-bottom valuations. But this relief rally, as good as it has been, still looks a bit long in the tooth: 1. Long-term money flows as per the 89-day Chaikin Money flow histogram (CMF)(89) are downright pathetic and confirm that the smart traders and investors have long since left this multimonth bear rally. 2. HPQ is closing in on its 50-month moving average, which is still sloping downward. 3. HPQ is trading near its February 2012 swing high of 30.00 after tracing out a not too pretty 5-wave impulse pattern since late 2012. 4. Fundamentally, it's hard to envision HPQ reinventing itself fast enough to overcome the long-term structural shift away from desktop PC's and notebook computers, and there seems to be no new revolutionary technology product in their pipeline that might help reverse the multiyear downtrend in their share price anytime soon. The big idea here is that there is a good chance that HPQ may again test its late 2012 lows sometime in 2014 — perhaps in the second half of the year unless a long overdue 10 to 20% correction in the major US stock indexes doesn't help bring the stock down much sooner. |
|
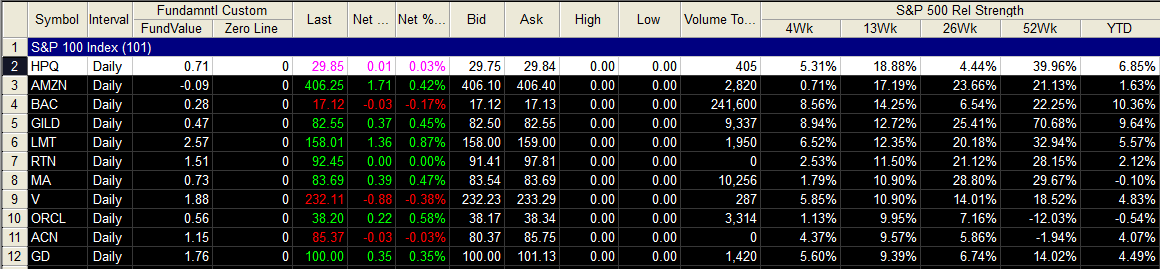
| Figure 2. HPQ still has good relative strength vs. the S&P 500 index over the past year but only fractionally outpaced its parent index over the past 26 week period. |
| Graphic provided by: TradeStation. |
| Graphic provided by: TradeStation RadarScreen. |
| |
| Playing HPQ here means looking to time a low risk short entry in the shares on a break back below near term support at 29.46. A break below that level implies that there is a supply zone above 30.00 and that the stock needs to pullback more before making another run back above the recent 30.13 swing high. For swing traders on 30-to 60-minute time frames, the key support levels to watch for HPQ are: 28.70, 27.75, 27.27, 26.29. Swing traders using daily charts need to be aware of key supports near 24.77, 23.64 and 20.75. No one knows whether HPQ's anticipated decline will happen fast or slow, but those are all key levels to watch, no matter how the selloff proceeds. Those going for the smaller price targets should keep their account risks smaller (perhaps a bit under 1%) while those going for the bigger gains of a deeper decline might want to go for 1.5 to 2% depending on their short selling experience level. Keeping your account risk manageable is the real key to surviving (and hopefully prospering) as a trader/investor, so make sure you always trade a little smaller size than you might want to, especially near critical "make or break" market levels. Trade wisely until we meet here again. |
Freelance financial markets writer and online publisher of the Trendzetterz.com S&P 500 Weekly Forecast service.
| Title: | Market consultant and writer |
| Company: | Trendzetterz |
| Address: | 81 Hickory Hollow Drive |
| Crossville, TN 38555 | |
| Phone # for sales: | 904-303-4814 |
| Website: | trendzetterz.com |
| E-mail address: | support@trendzetterz.com |
Traders' Resource Links | |
| Trendzetterz has not added any product or service information to TRADERS' RESOURCE. | |
Click here for more information about our publications!
PRINT THIS ARTICLE

Request Information From Our Sponsors
- StockCharts.com, Inc.
- Candle Patterns
- Candlestick Charting Explained
- Intermarket Technical Analysis
- John Murphy on Chart Analysis
- John Murphy's Chart Pattern Recognition
- John Murphy's Market Message
- MurphyExplainsMarketAnalysis-Intermarket Analysis
- MurphyExplainsMarketAnalysis-Visual Analysis
- StockCharts.com
- Technical Analysis of the Financial Markets
- The Visual Investor
- VectorVest, Inc.
- Executive Premier Workshop
- One-Day Options Course
- OptionsPro
- Retirement Income Workshop
- Sure-Fire Trading Systems (VectorVest, Inc.)
- Trading as a Business Workshop
- VectorVest 7 EOD
- VectorVest 7 RealTime/IntraDay
- VectorVest AutoTester
- VectorVest Educational Services
- VectorVest OnLine
- VectorVest Options Analyzer
- VectorVest ProGraphics v6.0
- VectorVest ProTrader 7
- VectorVest RealTime Derby Tool
- VectorVest Simulator
- VectorVest Variator
- VectorVest Watchdog