

HOT TOPICS LIST
- MACD
- Fibonacci
- RSI
- Gann
- ADXR
- Stochastics
- Volume
- Triangles
- Futures
- Cycles
- Volatility
- ZIGZAG
- MESA
- Retracement
- Aroon
INDICATORS LIST
LIST OF TOPICS
PRINT THIS ARTICLE
by Donald W. Pendergast, Jr.
Down by more than 16% since making a significant swing high in November 2013, shares of Trans Ocean Ltd. once again have heavy bearish momentum working against them.
Position: N/A
Donald W. Pendergast, Jr.
Freelance financial markets writer and online publisher of the Trendzetterz.com S&P 500 Weekly Forecast service.
PRINT THIS ARTICLE
MACD
RIG: Bearish Daily And Weekly Momentum
01/21/14 03:32:21 PMby Donald W. Pendergast, Jr.
Down by more than 16% since making a significant swing high in November 2013, shares of Trans Ocean Ltd. once again have heavy bearish momentum working against them.
Position: N/A
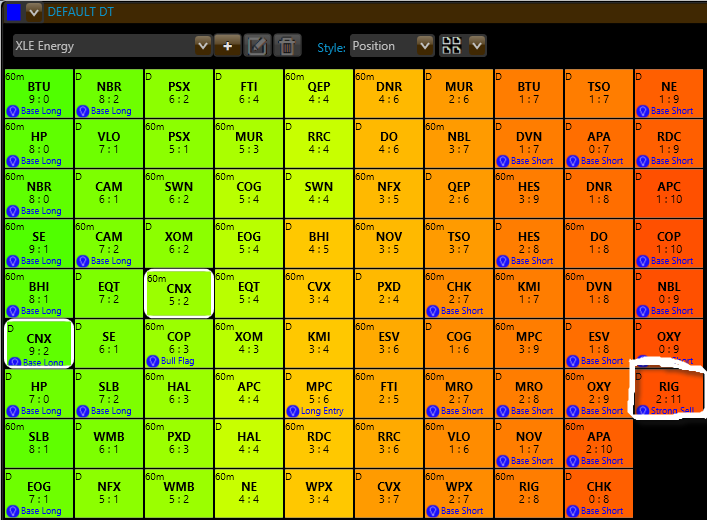
| Oil service industry group stocks tend to be an action-packed, highly volatile bunch; when the group as a whole begins to trend well, that's the time to start looking for the relative strength leaders/laggards within the group in hopes of latching on to a powerful swing or trending move. Here's a look at a poor-performing oil service group member — TransOcean Ltd (RIG). |
|
| Figure 1. With a Trend Score of 1:11, shares of Trans Ocean Ltd. have been identified as a "strong sell" by the Phantom Trader software algorithms. |
| Graphic provided by: Phantom Trader by KnowVera Research LLC. |
| |
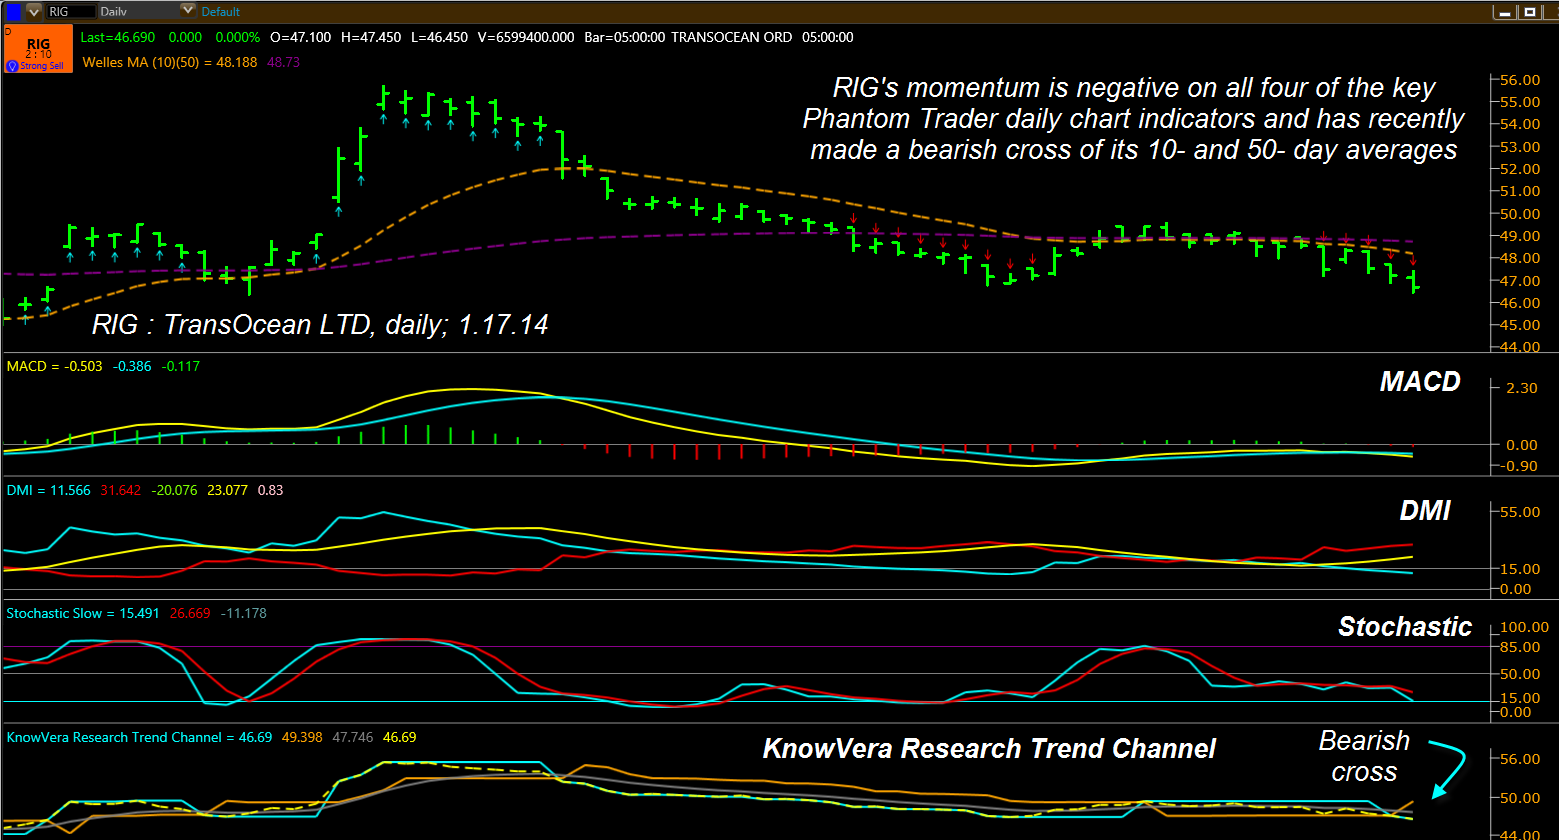
| Scanning for momentum trade setups can often lead traders/investors to stocks/ETFs that are just beginning to make sustained moves, higher or lower. The Trend Monitor in Phantom Trader is one of the simplest and useful of market scanners and allows for fast visual analysis and confirmation of market trends on multiple trading time frames. As of the close of trading on Friday January 17, 2014, shares of Trans Ocean Ltd. (RIG) were listed as the most bearish of all oil service component stocks within XLE (SPDRS Energy Sector ETF), coming in with a trend score of 1:11 and have also been tagged as a "strong sell" by the software's algorithm (Figure 1). Given that the most negative score possible in Phantom Trader is 0:12, it would appear that RIG is under heavy bearish pressure now. Clicking on the cell for RIG brings up a daily chart (Figure 2) which indeed confirms the following: 1. MACD recently turned negative. 2. DMI (Directional Movement Index) has been negative for nearly two weeks. 3. ADX (Average Directional Movement Index), a component of the DMI indicator itself is also rising steadily, confirming an increase in bearish momentum. 4. Stochastic is still moving lower. 5. The trend channel indicator (bottom of chart) crossed into bearish mode one session ago; this channel takes considerable shifts in momentum to cause it to change direction, so this is a strongly bearish confirmation for RIG on the daily time frame. 6. Weekly MACD (not shown) has also gone bearish. 7. Weekly money flows (CMF)(21) are still bearish. 8. The trend channel on the weekly chart for RIG is also close to making a bearish cross. Obviously, there are many bearish technical dynamics at work now in RIG and when you also consider that the stock has also been under performing the S&P 500 index (.SPX) over the past 4-, 13-, 26- and 52-week time periods, the bulls would have a hard time convincing savvy traders that RIG was a great buy right now. |
|
| Figure 2. Trans Ocean's (RIG) daily chart reveals that all four momentum indicators have turned negative; in addition, the stock recently made a bearish cross of its 10-and 50-day moving averages. |
| Graphic provided by: Phantom Trader by KnowVera Research LLC. |
| |
| Traders closed the large open gap from late October 2013 during the January 17, 2014 session and also managed to push RIG below its key support level of 46.77 the same day; the stock now sits in a heavily defended support area and it will not be surprising to see a minor bounce within the next few sessions; should this happen, monitor the stock closely on its 30- to 60-minute time frames for signs of exhaustion and then consider shorting with increasing share sizes as the stock rolls over and falls to test major support near 46.45 (the January 17th low). If you see 46.45 get taken out on big volume, assume that the dam has burst and try to already be on board by then for a fast trip south toward the 45.00 area. As long as all of the key momentum indicators are still pointing lower at the time of a break below 46.45, it will be fairly safe to stay in a short RIG trade until the heavy support near 45.00 is reached. The trend channel on the daily chart can be used as a guide to help with placement of your trailing stop. This is a momentum style trade and is less risky than a reversal style trade; still, you may want to keep your account trade risk modest, near 1% if you are more conservative. Aggressive, skilled short sellers might want to risk up to 2% of their account value on this particular setup. Trade wisely until we meet here again. |
Freelance financial markets writer and online publisher of the Trendzetterz.com S&P 500 Weekly Forecast service.
| Title: | Market consultant and writer |
| Company: | Trendzetterz |
| Address: | 81 Hickory Hollow Drive |
| Crossville, TN 38555 | |
| Phone # for sales: | 904-303-4814 |
| Website: | trendzetterz.com |
| E-mail address: | support@trendzetterz.com |
Traders' Resource Links | |
| Trendzetterz has not added any product or service information to TRADERS' RESOURCE. | |
Click here for more information about our publications!
Comments

Request Information From Our Sponsors
- StockCharts.com, Inc.
- Candle Patterns
- Candlestick Charting Explained
- Intermarket Technical Analysis
- John Murphy on Chart Analysis
- John Murphy's Chart Pattern Recognition
- John Murphy's Market Message
- MurphyExplainsMarketAnalysis-Intermarket Analysis
- MurphyExplainsMarketAnalysis-Visual Analysis
- StockCharts.com
- Technical Analysis of the Financial Markets
- The Visual Investor
- VectorVest, Inc.
- Executive Premier Workshop
- One-Day Options Course
- OptionsPro
- Retirement Income Workshop
- Sure-Fire Trading Systems (VectorVest, Inc.)
- Trading as a Business Workshop
- VectorVest 7 EOD
- VectorVest 7 RealTime/IntraDay
- VectorVest AutoTester
- VectorVest Educational Services
- VectorVest OnLine
- VectorVest Options Analyzer
- VectorVest ProGraphics v6.0
- VectorVest ProTrader 7
- VectorVest RealTime Derby Tool
- VectorVest Simulator
- VectorVest Variator
- VectorVest Watchdog