

HOT TOPICS LIST
- MACD
- Fibonacci
- RSI
- Gann
- ADXR
- Stochastics
- Volume
- Triangles
- Futures
- Cycles
- Volatility
- ZIGZAG
- MESA
- Retracement
- Aroon
INDICATORS LIST
LIST OF TOPICS
PRINT THIS ARTICLE
by Koos van der Merwe
When the market shows signs of weakness, money looks for dividend bearing stocks rather than growth.
Position: Buy
Koos van der Merwe
Has been a technical analyst since 1969, and has worked as a futures and options trader with First Financial Futures in Johannesburg, South Africa.
PRINT THIS ARTICLE
ELLIOTT WAVE
Canadian General Investments
01/21/14 03:41:32 PMby Koos van der Merwe
When the market shows signs of weakness, money looks for dividend bearing stocks rather than growth.
Position: Buy
| Canadian General Investments Ltd. is a closed-end equity fund focused on medium- to long-term investments in Canadian corporations. The company may, on occasion, invest in foreign securities, typically not exceeding 15% on aggregate of the portfolio's fair value. On December 10, 2013 the company declared a special cash capital gains dividend of $0.50 per common share payable on December 27, 2013 to shareholders of record on December 23, 2013. Including the quarterly dividends of $0.06 per common share for the first three quarters of the year and $0.08 for the fourth quarter, total annual cash dividend payments of $0.76 per common share in 2013 represent a yield to investors of 4.1% based on the December 9, 2013 closing share price of $18.44. The company, established in 1930, is one of Canada's largest closed-end investment companies with total portfolio assets in excess of $680 million as of December 9, 2013. |
|
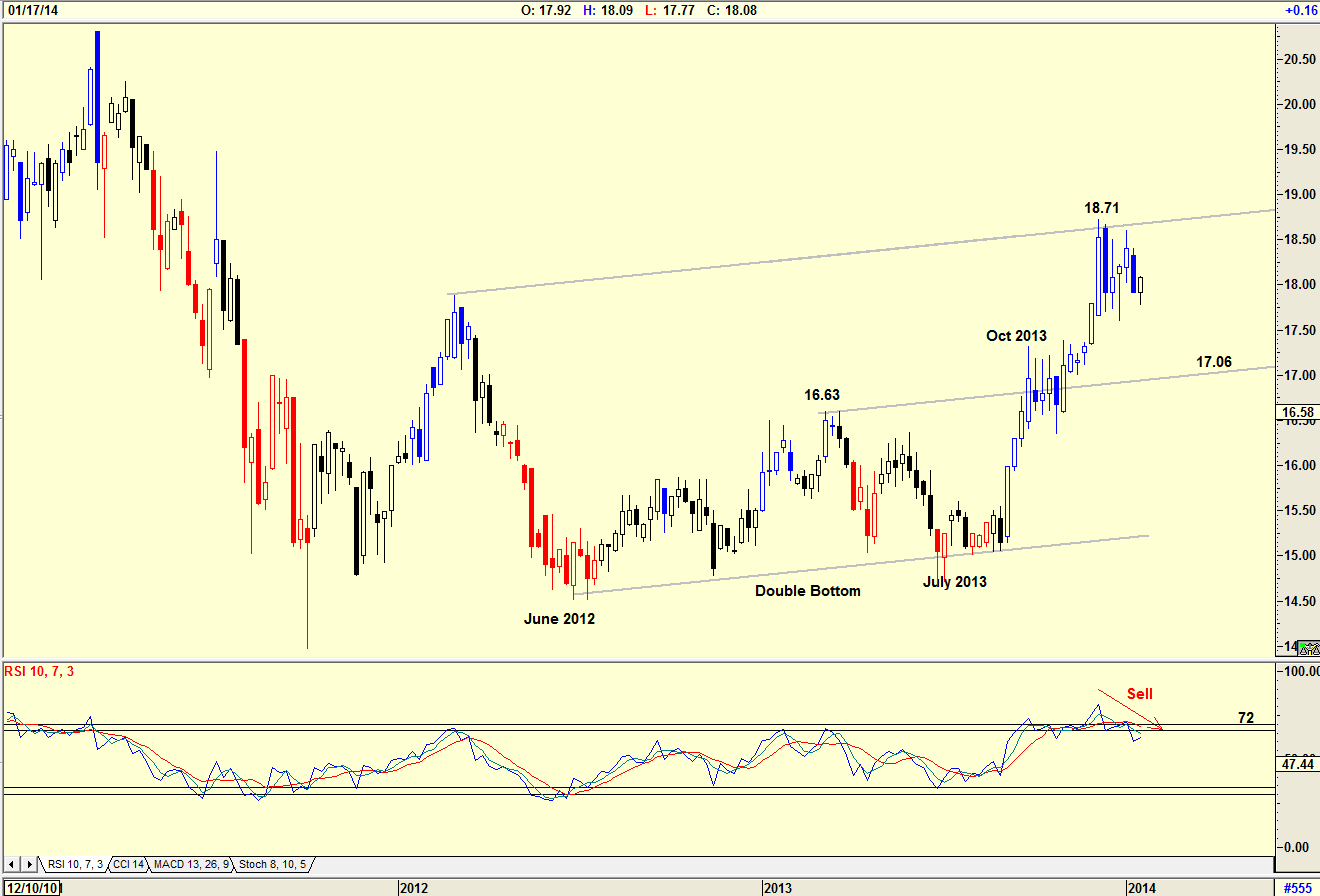
| Figure 1. Weekly chart showing 'W' pattern and target. |
| Graphic provided by: AdvancedGET. |
| |
| The chart in Figure 1 is a weekly chart, and shows the double bottom that formed from June 2012 to July 2013. The 'W' pattern suggests a rise above $16.63, and the share price tested this resistance in October 2013, then broke out to rise to the upper resistance line at $18.71. Note that the RSI indicator has presently given a sell signal, moving above the upper 72 horizontal line and then moving below it. This suggests that the price will fall to find support at $17.06, the line drawn parallel from the $16.63 level, the center of the 'W' pattern. |
|
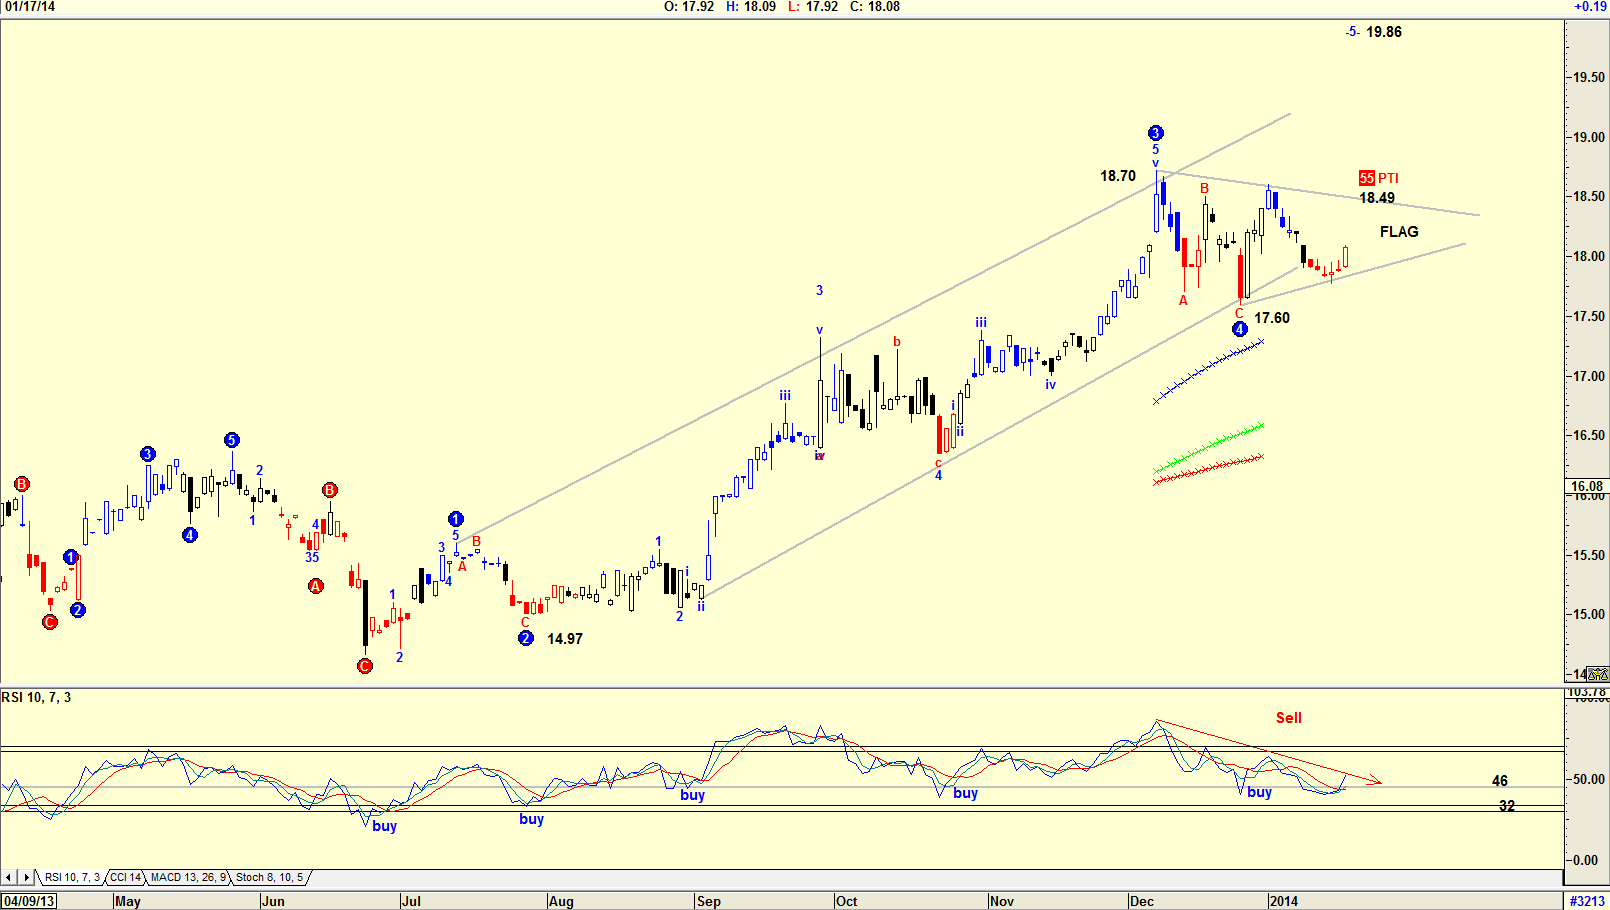
| Figure 2. Daily chart showing flag formation and target. |
| Graphic provided by: AdvancedGET. |
| |
| The chart in Figure 2, a daily chart, shows an Elliott Wave count that suggests the price could rise in a WAVE 5 to $19.96. The Probability Index (PTI) is suggesting that the possibility of this occurring is 55%. Looking back at RSI buy signals, you can see that a number of buy signals were triggered when the share price fell below the 46 level, then recovered. With the flag pattern that has developed, if price breaks out of the upper flag resistance level at about the $18.49 level, the price should target $21.33 (18.70-14.97=3.73+17.60=21.33). |
|
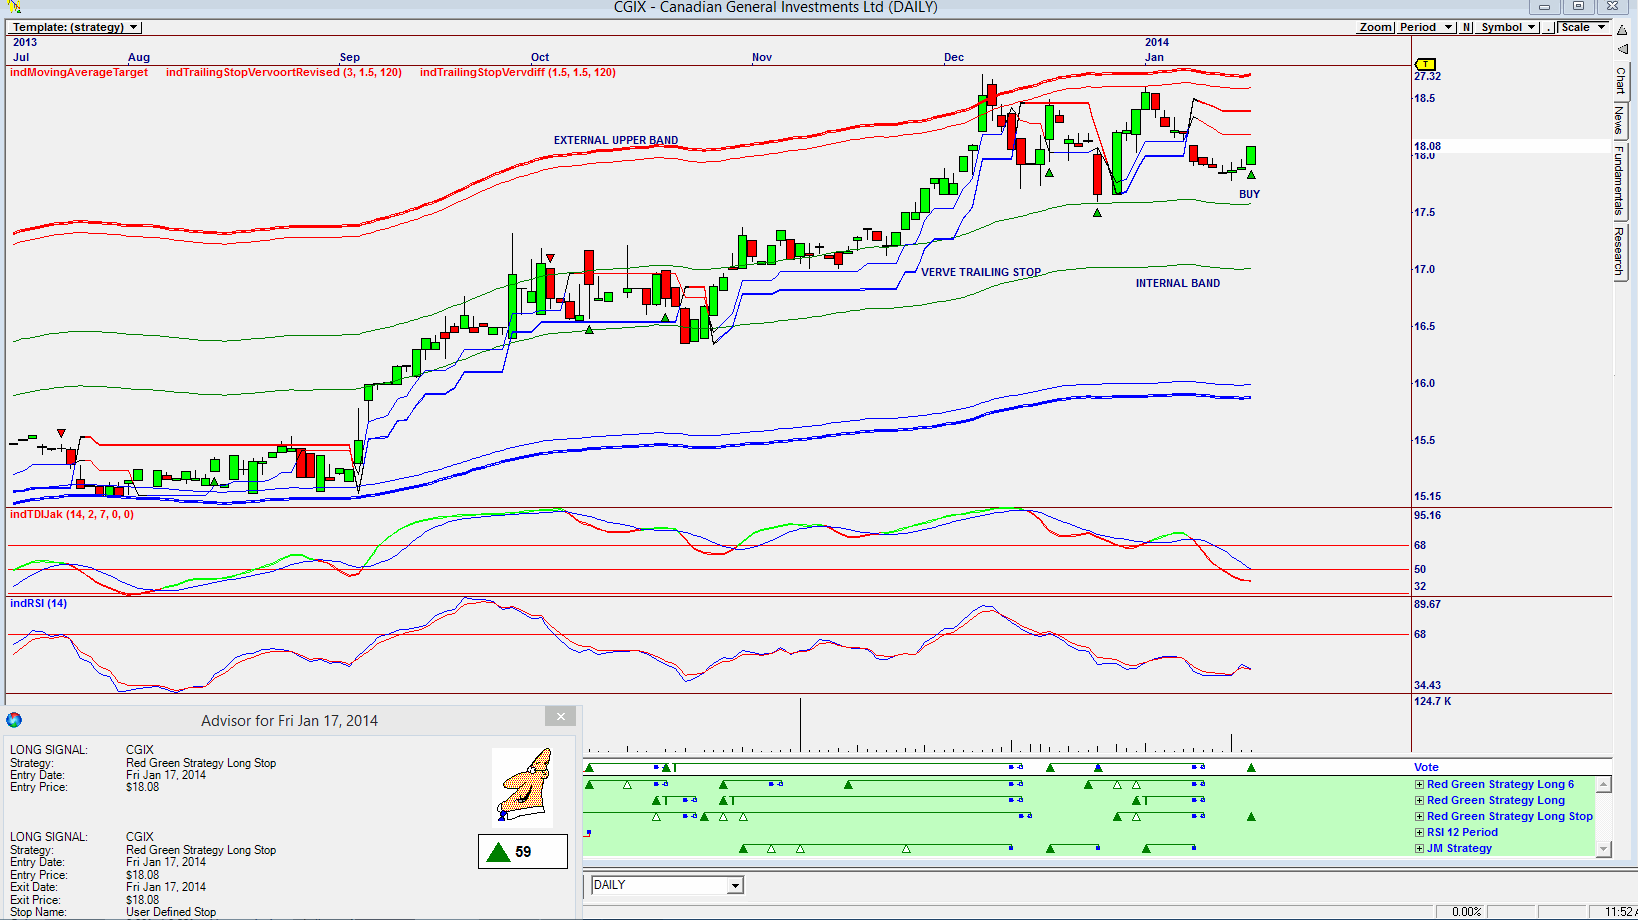
| Figure 3. Omnitrader chart showing buy signal on Vote line. |
| Graphic provided by: Omnitrader. |
| |
| The Omnitrader Chart in Figure 3 is what brought the share to my attention. The Vote line has given a buy signal based on the Red Green Strategy Long stop. The Advisor rating shown on the chart is at 59, a comfortable rating. Note how the share price found support on the upper internal band and found resistance on the upper external band. Also note the sell signal when the chart broke below the Verve trailing stop, as a stop shown on the Vote line. The TDIJak indicator is still negative, but the RSI indicator has suggested a buy signal. I would be a buyer of Canadian General Investments at present levels, knowing it is a short-term hold for growth. The current yield is below my 7% threshold, so I would not hold the share for yield. However, should the share price fall to lower levels sometime in the future, I may reconsider. |
Has been a technical analyst since 1969, and has worked as a futures and options trader with First Financial Futures in Johannesburg, South Africa.
| Address: | 3256 West 24th Ave |
| Vancouver, BC | |
| Phone # for sales: | 6042634214 |
| E-mail address: | petroosp@gmail.com |
Click here for more information about our publications!
PRINT THIS ARTICLE

Request Information From Our Sponsors
- StockCharts.com, Inc.
- Candle Patterns
- Candlestick Charting Explained
- Intermarket Technical Analysis
- John Murphy on Chart Analysis
- John Murphy's Chart Pattern Recognition
- John Murphy's Market Message
- MurphyExplainsMarketAnalysis-Intermarket Analysis
- MurphyExplainsMarketAnalysis-Visual Analysis
- StockCharts.com
- Technical Analysis of the Financial Markets
- The Visual Investor
- VectorVest, Inc.
- Executive Premier Workshop
- One-Day Options Course
- OptionsPro
- Retirement Income Workshop
- Sure-Fire Trading Systems (VectorVest, Inc.)
- Trading as a Business Workshop
- VectorVest 7 EOD
- VectorVest 7 RealTime/IntraDay
- VectorVest AutoTester
- VectorVest Educational Services
- VectorVest OnLine
- VectorVest Options Analyzer
- VectorVest ProGraphics v6.0
- VectorVest ProTrader 7
- VectorVest RealTime Derby Tool
- VectorVest Simulator
- VectorVest Variator
- VectorVest Watchdog