

HOT TOPICS LIST
- MACD
- Fibonacci
- RSI
- Gann
- ADXR
- Stochastics
- Volume
- Triangles
- Futures
- Cycles
- Volatility
- ZIGZAG
- MESA
- Retracement
- Aroon
INDICATORS LIST
LIST OF TOPICS
PRINT THIS ARTICLE
by Donald W. Pendergast, Jr.
Up by as much as 55% between June 2012 and November 2013, shares of Johnson and Johnson may be ready to stall and reverse lower.
Position: N/A
Donald W. Pendergast, Jr.
Freelance financial markets writer and online publisher of the Trendzetterz.com S&P 500 Weekly Forecast service.
PRINT THIS ARTICLE
ACCUM./DIST. CHAIKIN
JNJ: A Final Rally Before Trend Reversal?
01/17/14 04:22:02 PMby Donald W. Pendergast, Jr.
Up by as much as 55% between June 2012 and November 2013, shares of Johnson and Johnson may be ready to stall and reverse lower.
Position: N/A
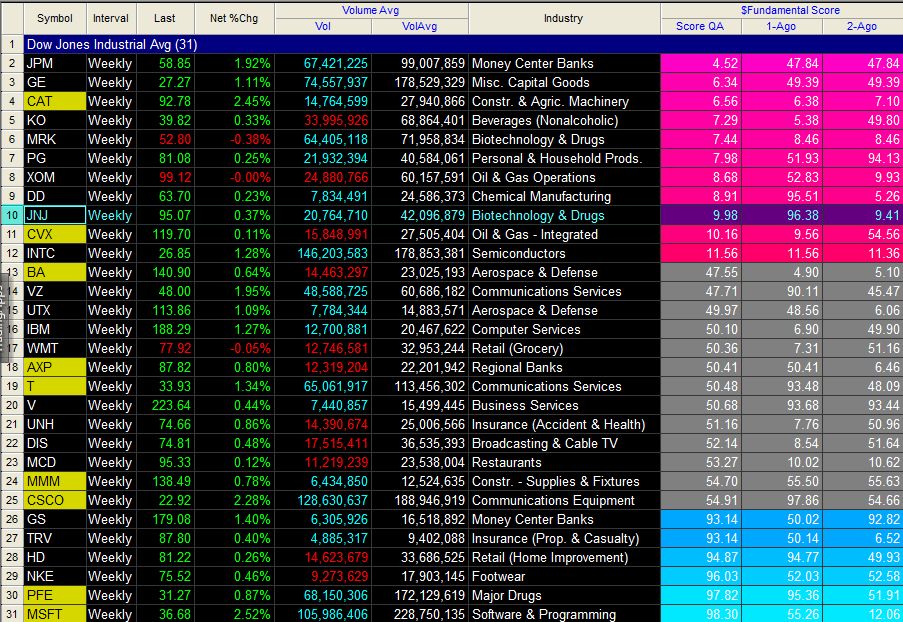
| Giant-cap stocks like Johnson and Johnson (JNJ) aren't usually as volatile as their lesser-cap counterparts, but they can still make tremendous trending moves from time to time. Here's a look at JNJ and its current technical positioning on its daily chart along with a key set of fundamental warning signs that a trend reversal or substantial correction may be overdue for this key Dow 30 Industrials health care component (Figure 1). |
|
| Figure 1. Among the Dow 30 (.DJIA, DIA) components, six have bullish fundamental scores, 11 have neutral scores and 11 have bearish scores. This particular fundamental score indicator is heavily weighted to the EPS input among the eight fundamental inputs used to calculate the final scores. |
| Graphic provided by: TradeStation. |
| Graphic provided by: TradeStation Fundamental Score Indicator. |
| |
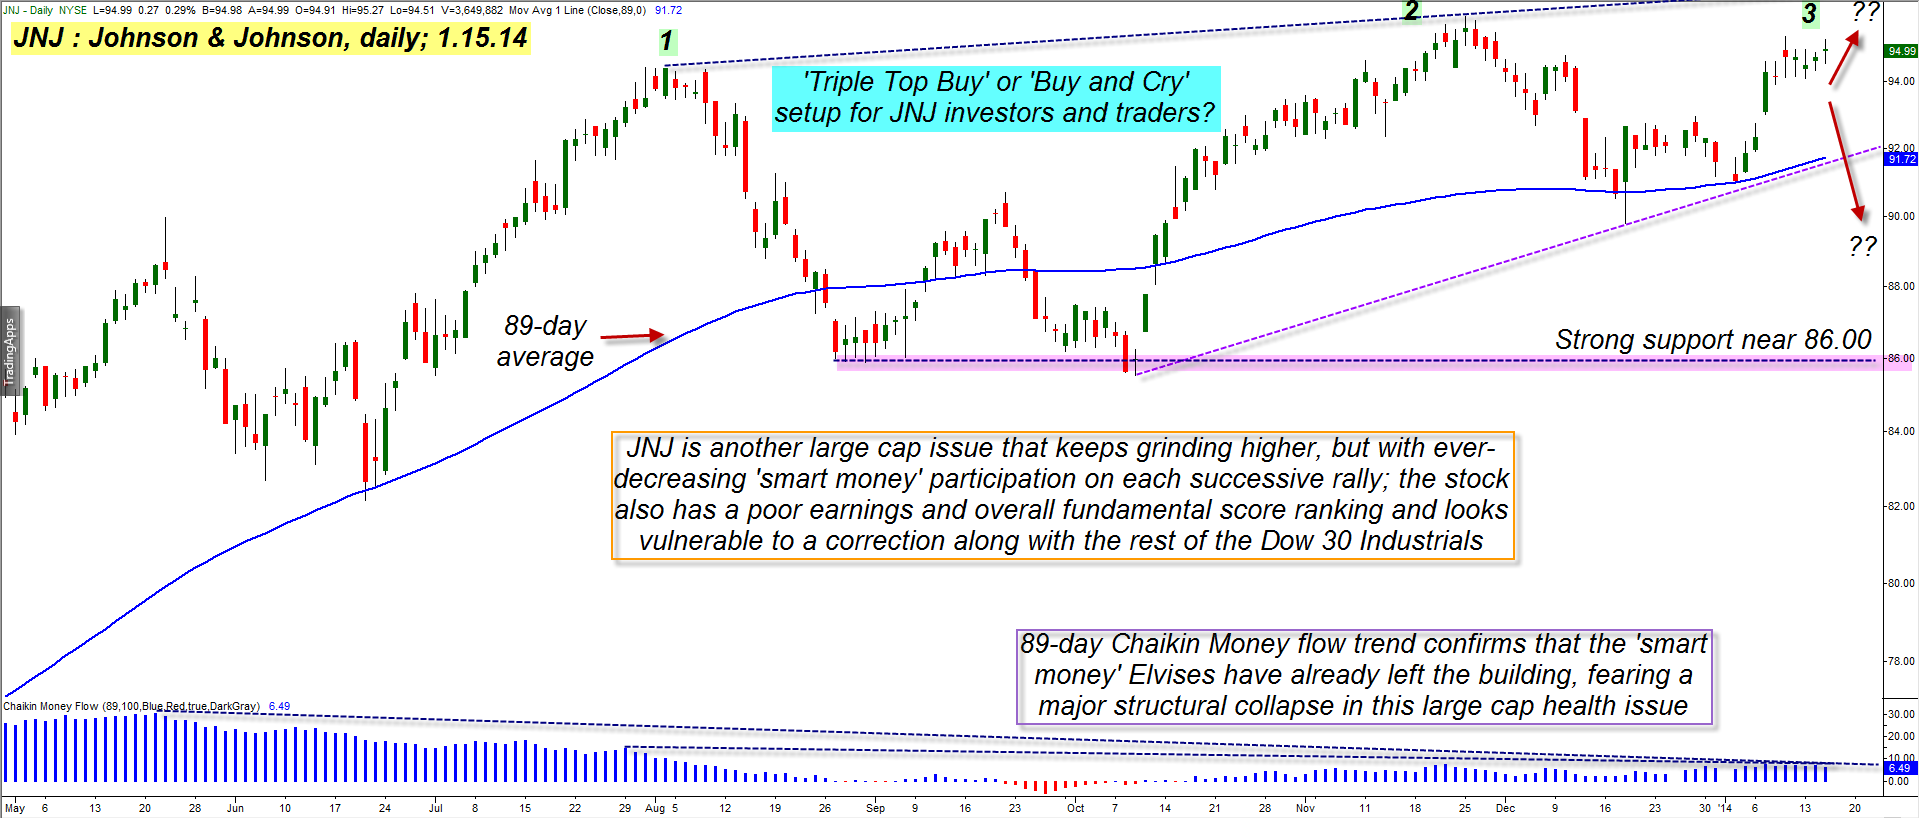
| JNJ was a few months ahead of most other Dow 30 stocks as it launched into its most recent sustained rally (Figure 2). From a major multicycle low of 61.71 on June 1, 2012 the stock powered higher in a big way — nearly 45% in just six months. Since then, the gains have been more modest as the stock has settled into more of a swing mode in the midst of a larger upward price cycle. Beginning with the late July 2013 swing high of 94.42 the stock moved into a wide trading range and is now near the upper end of that range. Savvy analysts can already see that this could morph into a triple-top buy setup (very bullish, all else being equal) even as they already see the following warning signs: 1. Long-term money flows (CMF)(89) are weak and are confirming that the "smart money" has been using the rallies since June 2013 to lighten up on their long JNJ positions. 2. JNJ's earnings rank in the TradeStation Fundamental Score Indicator (reformatted with a heavy earnings per share weighting) shows the stock with a "bearish" ranking and minuscule score. 3. JNJ has been under-performing the S&P 500 index (.SPX, SPY) over the past 13- and 26-week time periods; institutional investors normally plow new cash into issues that are outperforming the broad market indexes, so this could be another warning sign to watch. |
|
| Figure 2. JNJ's weak long term money flow pattern confirms that distribution had been underway since June 2013. Strong support near 86.00 could be an area to watch should the stock decline in a big way as 2014 unfolds. |
| Graphic provided by: TradeStation. |
| |
| Now, of course, this epic bull market since March 2009 has shown an amazing ability to bounce back — time after time — and disappoint the permabears, but at some point the whole shebang comes unglued and a major correction will ensue. In anticipation of such an eventuality, it pays to start building a watch list of liquid, large cap stocks that have all of the following attributes: 1. Negative fundamentals (declining sales or EPS growth). 2. Bearish long-term and short-term money flow divergences. 3. Poor comparative strength vs. the major US stock indexes. 4. If the stock has recently (within the past few months) made multiyear highs and then fails to exceed that high on a subsequent rally — while exhibiting the attributes in points 1, 2 and 3 — you may have a great candidate for shorting once the major indexes finally reverse in a big way. Start making that short sale watch list now and you'll likely be well-rewarded as the long-anticipated, epic bear market of 2014 through 2017 progressively unfolds. |
Freelance financial markets writer and online publisher of the Trendzetterz.com S&P 500 Weekly Forecast service.
| Title: | Market consultant and writer |
| Company: | Trendzetterz |
| Address: | 81 Hickory Hollow Drive |
| Crossville, TN 38555 | |
| Phone # for sales: | 904-303-4814 |
| Website: | trendzetterz.com |
| E-mail address: | support@trendzetterz.com |
Traders' Resource Links | |
| Trendzetterz has not added any product or service information to TRADERS' RESOURCE. | |
Click here for more information about our publications!
PRINT THIS ARTICLE

Request Information From Our Sponsors
- StockCharts.com, Inc.
- Candle Patterns
- Candlestick Charting Explained
- Intermarket Technical Analysis
- John Murphy on Chart Analysis
- John Murphy's Chart Pattern Recognition
- John Murphy's Market Message
- MurphyExplainsMarketAnalysis-Intermarket Analysis
- MurphyExplainsMarketAnalysis-Visual Analysis
- StockCharts.com
- Technical Analysis of the Financial Markets
- The Visual Investor
- VectorVest, Inc.
- Executive Premier Workshop
- One-Day Options Course
- OptionsPro
- Retirement Income Workshop
- Sure-Fire Trading Systems (VectorVest, Inc.)
- Trading as a Business Workshop
- VectorVest 7 EOD
- VectorVest 7 RealTime/IntraDay
- VectorVest AutoTester
- VectorVest Educational Services
- VectorVest OnLine
- VectorVest Options Analyzer
- VectorVest ProGraphics v6.0
- VectorVest ProTrader 7
- VectorVest RealTime Derby Tool
- VectorVest Simulator
- VectorVest Variator
- VectorVest Watchdog