HOT TOPICS LIST
- MACD
- Fibonacci
- RSI
- Gann
- ADXR
- Stochastics
- Volume
- Triangles
- Futures
- Cycles
- Volatility
- ZIGZAG
- MESA
- Retracement
- Aroon
INDICATORS LIST
LIST OF TOPICS
PRINT THIS ARTICLE
by Koos van der Merwe
When a stock rises, and rises and continues to rise, surely there must be a correction?
Position: Sell
Koos van der Merwe
Has been a technical analyst since 1969, and has worked as a futures and options trader with First Financial Futures in Johannesburg, South Africa.
PRINT THIS ARTICLE
ELLIOTT WAVE
A Stock Looking For A Correction
01/17/14 04:16:25 PMby Koos van der Merwe
When a stock rises, and rises and continues to rise, surely there must be a correction?
Position: Sell
| No stock continues to rise to the moon without a correction somewhere along the line. When a share price starts going up almost vertically, you start to look for a trigger that will cause the stock to correct, whether it is a fundamental trigger, or a technical trigger. One such stock is Gilead Sciences (GILD). |

|
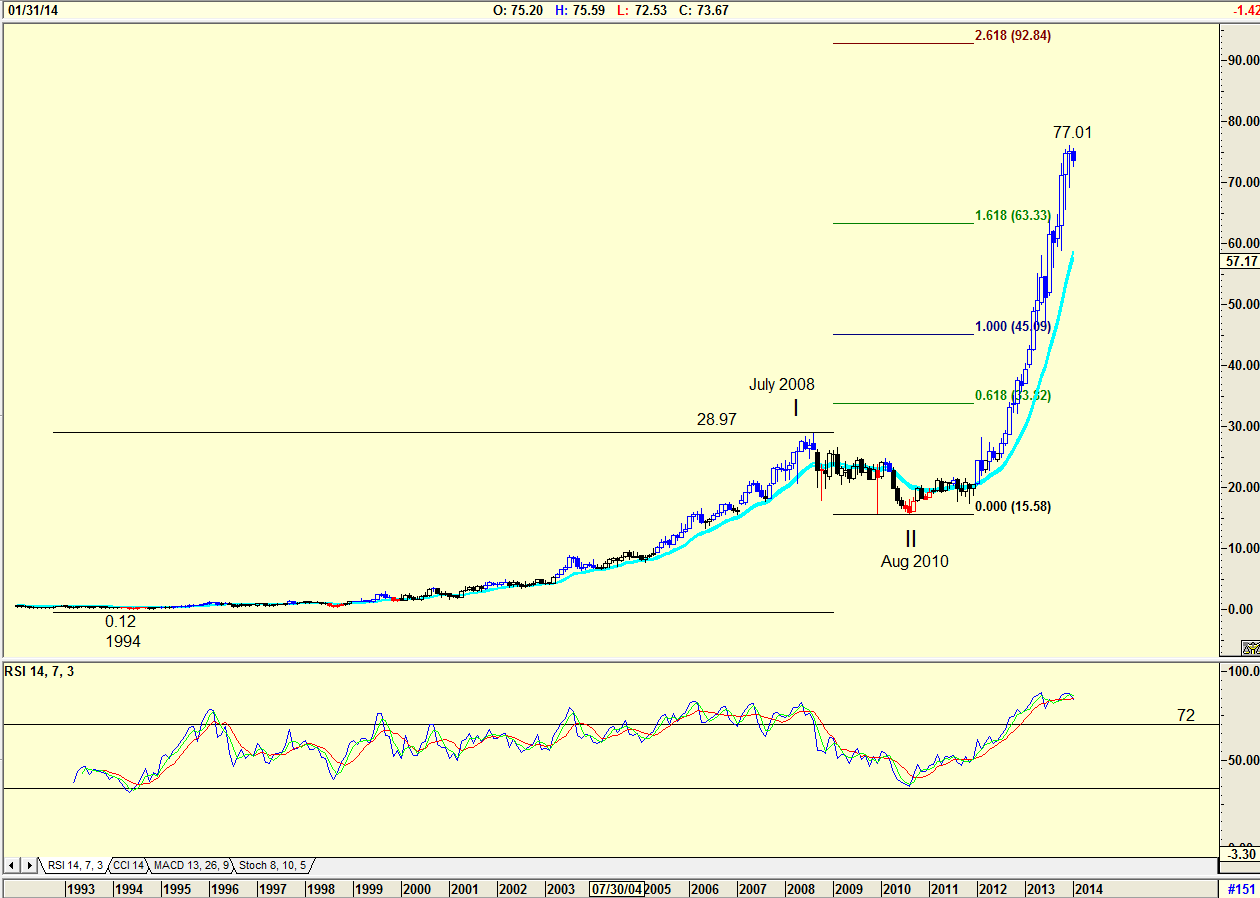
| Figure 1. Monthly chart of Gilead Sciences. |
| Graphic provided by: AdvancedGET. |
| |
| The chart in Figure 1 is a monthly chart that shows how GILD has risen from a low of 12 cents in 1994 to its present high of $77.01. The share price corrected in a Wave I and Wave II between July 2008 and August 2010. Since then it has risen dramatically in a Wave III shooting past all probable turning points. A wave 3 is expected to be equal or greater than Wave I, with an estimate price target of the Fibonacci number 1.618. The chart shows that the price shot through the 1.618 target of $63.33 to a high of $77.01. The price could target the next Fibonacci number of 2.618, a price of $92.84, but the RSI indicator shown on the chart is at overbought levels, suggesting caution. The indicator has, however, not given a sell signal — a drop below the 72 line — and previous history has shown that it can remain at oversold levels for some time as the price continues to climb before a sell signal is given. |

|
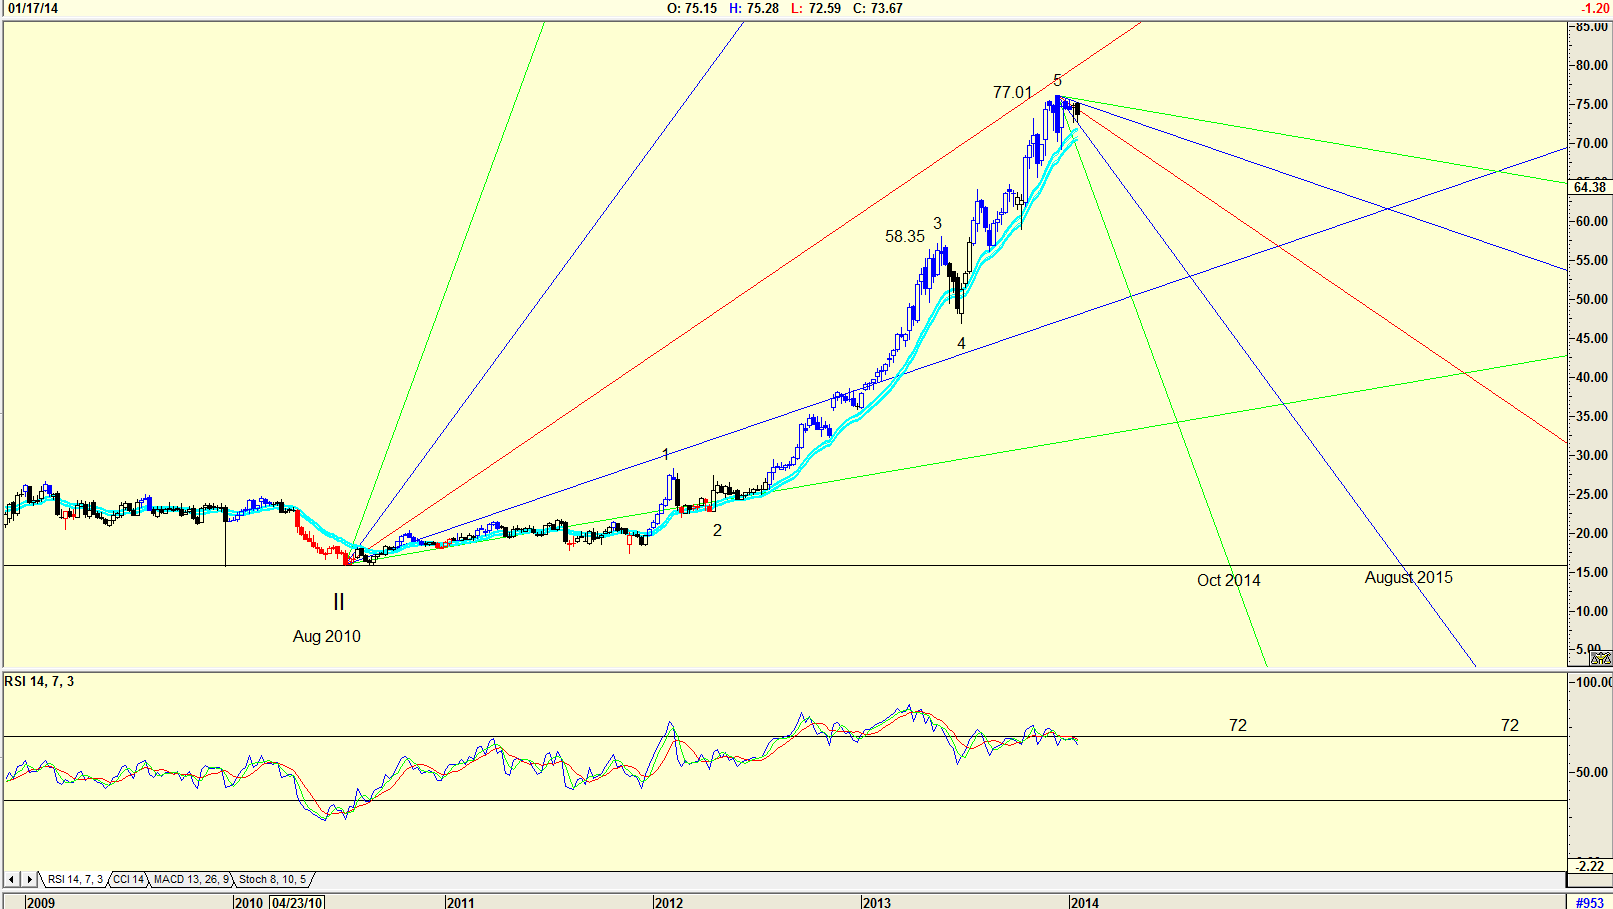
| Figure 2. Weekly chart showing Gann cyclical fans. |
| Graphic provided by: AdvancedGET. |
| |
| The weekly chart in Figure 2 shows an Elliott Wave count that suggests an ABC correction is on the cards. The chart suggests that at $77.01 the share price reached a Wave 5 high, and could now correct to the $58.35 level, the fourth wave of lesser degree in an ABC correction. The Gann fans on the chart suggest that the correction could bottom in October 2014 and as far out as August 2015, although the latter is too far out to be acceptable. The Gann fan cycle is determined when the fan crosses the horizontal line drawn from a previous low that determined the fan parameters. Do note the RSI which has given a sell signal. |

|
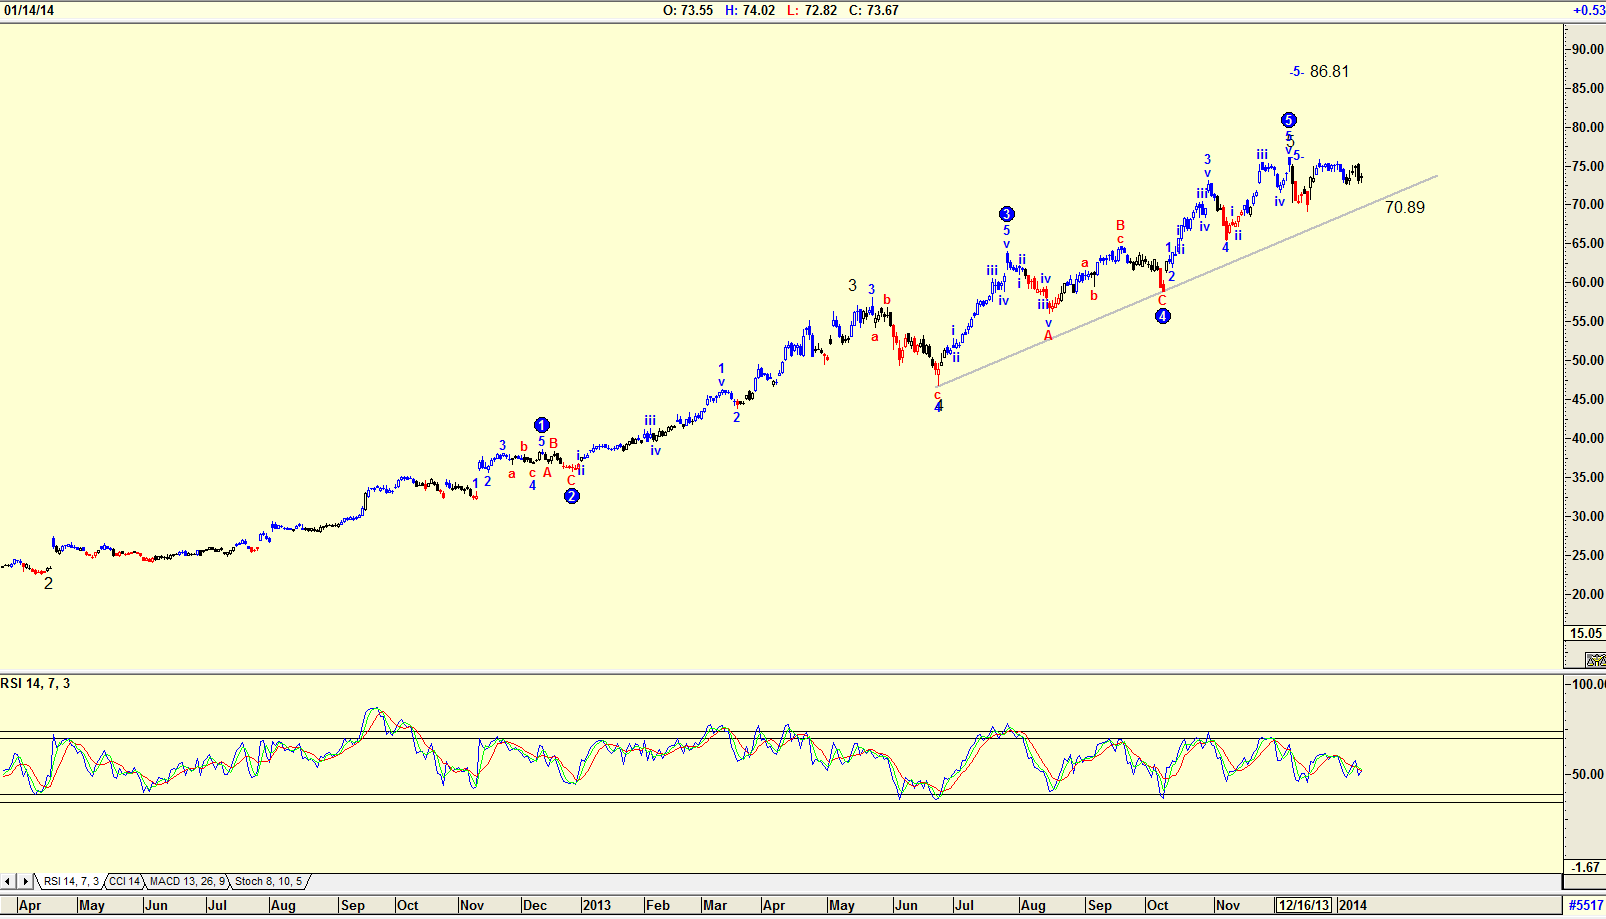
| Figure 3 Daily chat with Elliott Wave count. |
| Graphic provided by: AdvancedGET. |
| |
| The chart in Figure 1 is a daily chart, with an Elliott Wave count suggesting that a Wave 5 could be complete. The Wave count is automatically calculated by the Advanced GET program, which is suggesting that the price could possibly rise to a wave 5 high of $86.81. The RSI indicator is however trending down from overbought levels, suggesting that this is unlikely. The share looks outstanding, and the solid rise in price is extremely tempting, but because of the Elliott Wave count and RSI indicator, I would be extremely cautious about buying the share at the moment. I would prefer waiting for the share price to drop further with the RSI indicator at oversold levels. |

|
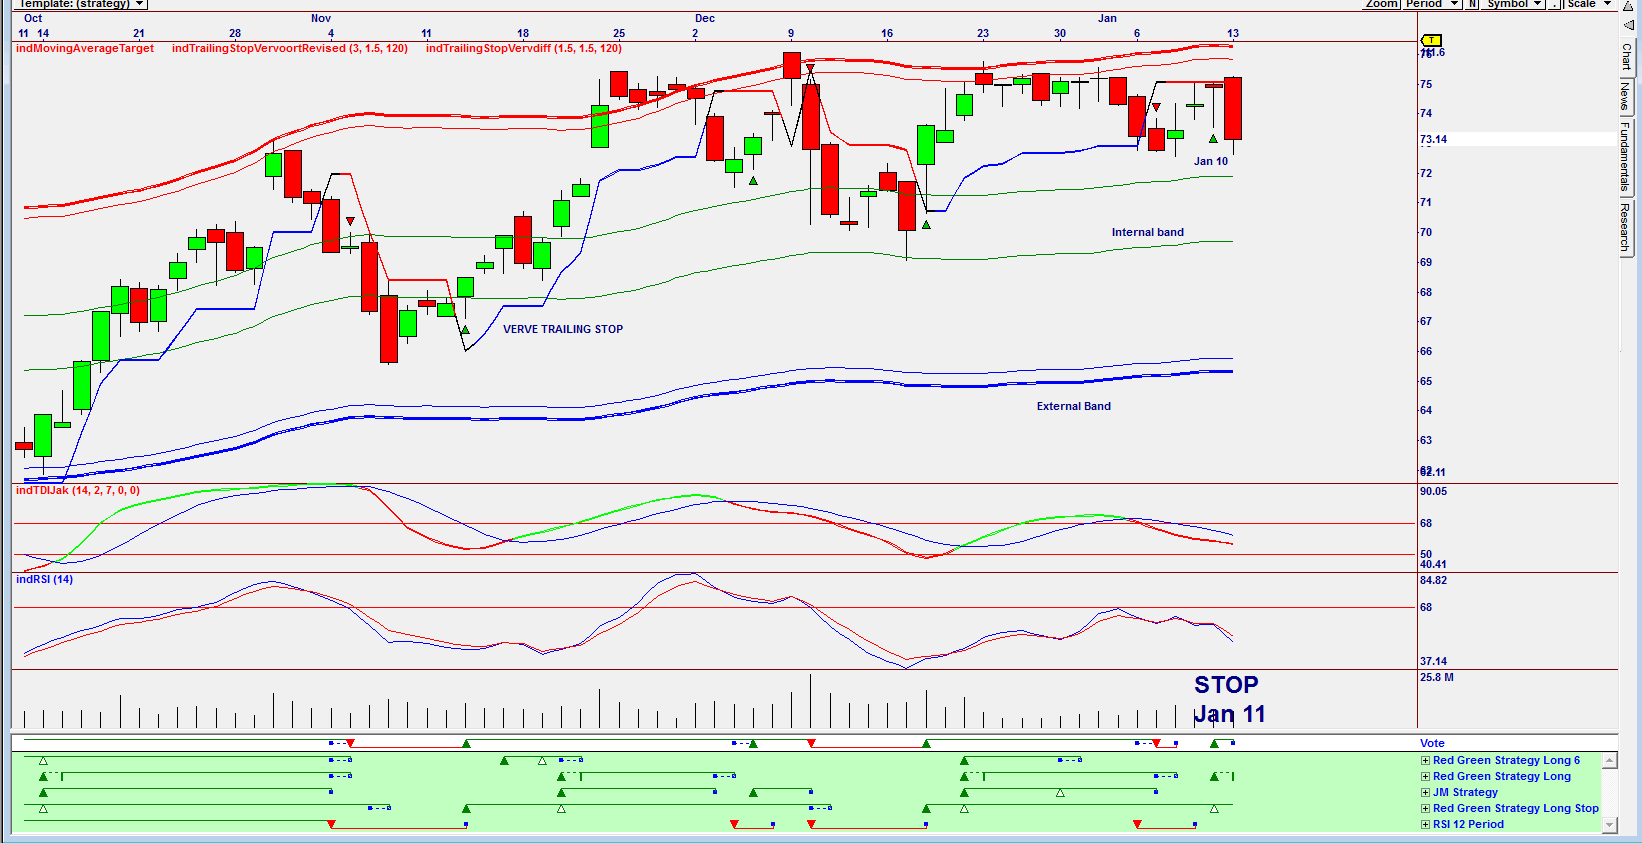
| Figure 4. Daily Omnitrader chart showing the Vote line Buy/Sell signals. |
| Graphic provided by: Omnitrader.. |
| |
| The final chart is an Omnitrader daily chart showing short term buy and sell signals. Note how the price gave a buy signal on January 10, 2014 as it tested the Verve trailing stop but stopped out on January 11, 2014 when the share price fell in line with market weakness. Note how the price reverses as it tests the upper external trading band, and how it finds support on the lower internal trading band. Also note that both the RSI 12-period and TDIJak indicators are in sell mode. Based on the Omnitrader chart, I would sit back and wait for a more convincing buy signal. It is a company that has captured me, but for the moment, caution prevails. |
Has been a technical analyst since 1969, and has worked as a futures and options trader with First Financial Futures in Johannesburg, South Africa.
| Address: | 3256 West 24th Ave |
| Vancouver, BC | |
| Phone # for sales: | 6042634214 |
| E-mail address: | petroosp@gmail.com |
Click here for more information about our publications!
Comments

Request Information From Our Sponsors
- StockCharts.com, Inc.
- Candle Patterns
- Candlestick Charting Explained
- Intermarket Technical Analysis
- John Murphy on Chart Analysis
- John Murphy's Chart Pattern Recognition
- John Murphy's Market Message
- MurphyExplainsMarketAnalysis-Intermarket Analysis
- MurphyExplainsMarketAnalysis-Visual Analysis
- StockCharts.com
- Technical Analysis of the Financial Markets
- The Visual Investor
- VectorVest, Inc.
- Executive Premier Workshop
- One-Day Options Course
- OptionsPro
- Retirement Income Workshop
- Sure-Fire Trading Systems (VectorVest, Inc.)
- Trading as a Business Workshop
- VectorVest 7 EOD
- VectorVest 7 RealTime/IntraDay
- VectorVest AutoTester
- VectorVest Educational Services
- VectorVest OnLine
- VectorVest Options Analyzer
- VectorVest ProGraphics v6.0
- VectorVest ProTrader 7
- VectorVest RealTime Derby Tool
- VectorVest Simulator
- VectorVest Variator
- VectorVest Watchdog
