

HOT TOPICS LIST
- MACD
- Fibonacci
- RSI
- Gann
- ADXR
- Stochastics
- Volume
- Triangles
- Futures
- Cycles
- Volatility
- ZIGZAG
- MESA
- Retracement
- Aroon
INDICATORS LIST
LIST OF TOPICS
PRINT THIS ARTICLE
by Donald W. Pendergast, Jr.
Gamestop Inc. 'A' shares have been hammered hard for the past nine weeks, but a key leading indicator can help uncover where its next major price support level is.
Position: N/A
Donald W. Pendergast, Jr.
Freelance financial markets writer and online publisher of the Trendzetterz.com S&P 500 Weekly Forecast service.
PRINT THIS ARTICLE
FIBONACCI
Gamestop: Fibonacci Swing Ratios Reveal Next Support Levels
01/16/14 02:51:00 PMby Donald W. Pendergast, Jr.
Gamestop Inc. 'A' shares have been hammered hard for the past nine weeks, but a key leading indicator can help uncover where its next major price support level is.
Position: N/A
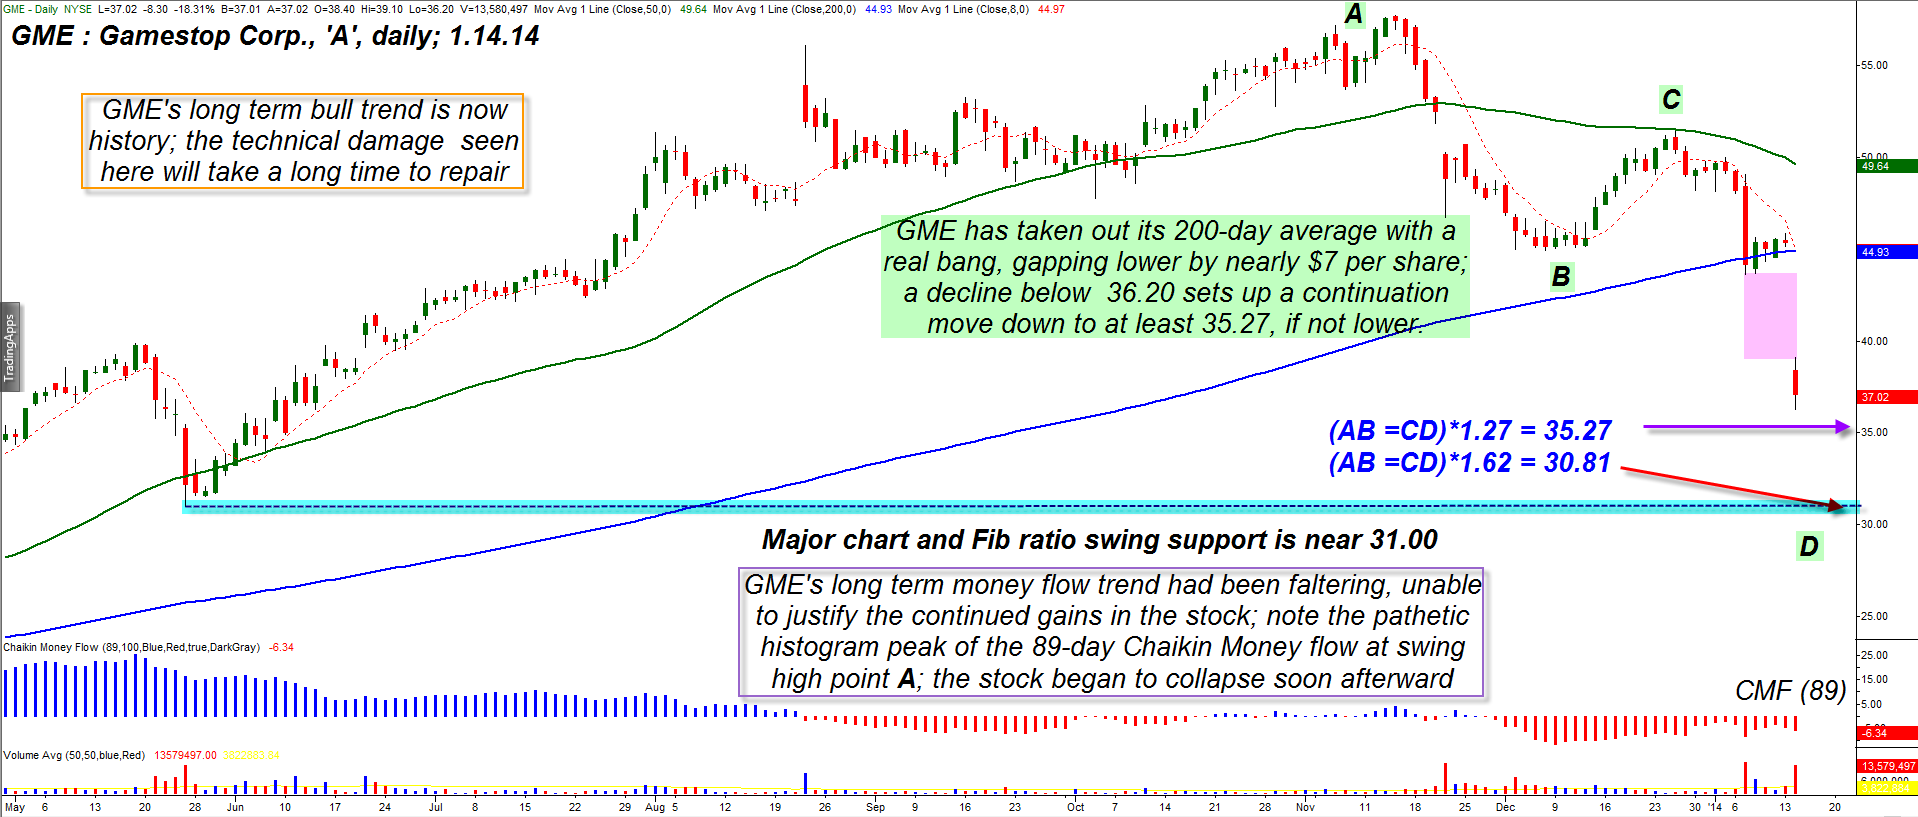
| Gamestop Inc. 'A' shares (GME) have been hit hard after peaking and rolling over in mid-November 2013; the smart money had been bailing out of the stock long before the peak at swing point A was reached on November 14, 2013 — for proof positive of this, just look at the 89-day Chaikin money flow histogram (CMF)(89) at the bottom of the daily chart; notice how after the stock made a major swing high in May 2013 the money flow never managed to rebound during the subsequent rallies leading up to swing high A. This was the phase of the long-term price markup where the big players in the stock were steadily selling out of their long positions, putting it into the hands of latecomers and other lesser-informed investors. As is almost always the case, it's these latecomers who get bludgeoned once the price peaks out and then they find themselves on the wrong side of the market as the smart money sharks pull the "stock market sheep slaughter short-selling button" (SM-4SB for short) taking the little market investor to the cleaners. In the case of GME, earnings and sales growth forecasts always initiate frantic bouts of panic buying and selling, and with the company warning that future sales growth could be slowing, the short selling in GME has been enough to take the stock down by more than 35% in only nine weeks. |
|
| Figure 1. Gamestop Inc. 'A' (GME) has already exceeded the 100% AB swing price target for swing CD, making further declines toward the 127% (35.27) and 162% (30.81) swing prices targets more likely. |
| Graphic provided by: TradeStation. |
| |
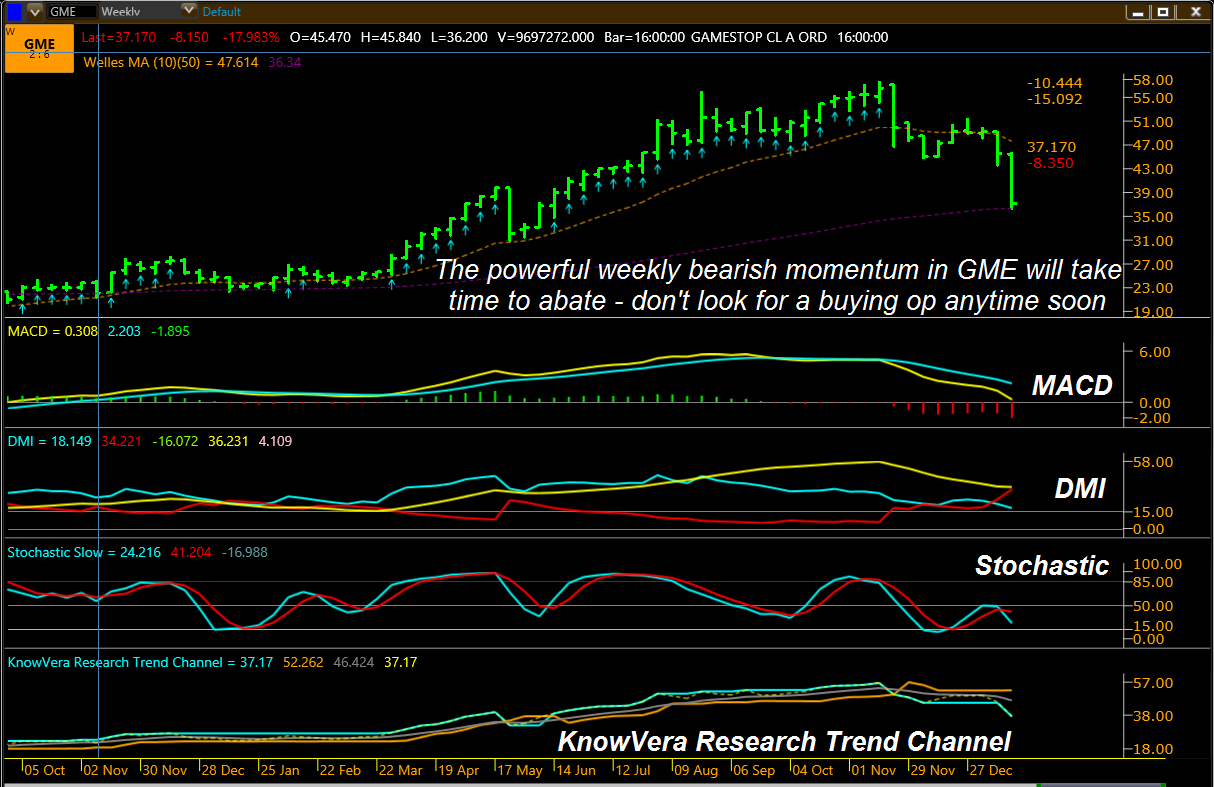
| For traders fortunate to short GME near swing point C (near 49.00 to 51.00) the big question now is whether or not to book profits now after such a large decline or to get a bit greedy and attempt to hold on for even lower valuations in this stock; using a basic Fibonacci ratio swing target ratio regimen can help answer that question: 1. Since swing CD has already exceeded the length of swing AB, we now set our sights on the next target of (AB=CD) * 1.27 which is a price target of 35.27. That is about $1.25 per share beneath the current price, and would be a perfect price zone in which to take at least half profits if already short GME. 2. The next target is based on (AB=CD) * 1.62 and that equates to a target price of 30.81. There is major chart support near 30.94 (see cyan support zone on chart), so these are in very close agreement that the area near 31.00 could act as a termination zone for swing CD, at least on this time frame. The weekly Phantom Trader chart for GME also reveals massive downward pressure in the stock; witness the mind-shatteringly bearish MACD, DMI, Stochastic and Trend Channel configurations for the stock. Although it would be risky to enter a new short now on the daily/weekly time frames, enterprising swing traders might still be able to time a minor pullback short entry on a 30-, 60- or 120-minute chart in the next few sessions, hoping to capitalize on such negative weekly/daily momentum forces. |
|
| Figure 2. Weekly momentum and trend indicators confirm the heavy downside pressure in shares of GME. Trying to pick a bottom here could be very risky; trading with the dominant trend in a stock or ETF is much more prudent. |
| Graphic provided by: Phantom Trader by KnowVera Research LLC. |
| |
| Clearly, GME has a lot of work to do before it's ever going to see its November 2013 high of 57.74; the bearish forces driving the stock are in ascendancy right now, and the stock is almost a cinch to reach the next Fib swing target of 35.27 within the next week — or less. If that target is exceeded, then the next target zone near 31.00 becomes more likely with every passing day. Monitor your GME shorts carefully and beware of a possible short-covering rally as either of the price target zones are reached. Trade wisely until we meet here again. |
Freelance financial markets writer and online publisher of the Trendzetterz.com S&P 500 Weekly Forecast service.
| Title: | Market consultant and writer |
| Company: | Trendzetterz |
| Address: | 81 Hickory Hollow Drive |
| Crossville, TN 38555 | |
| Phone # for sales: | 904-303-4814 |
| Website: | trendzetterz.com |
| E-mail address: | support@trendzetterz.com |
Traders' Resource Links | |
| Trendzetterz has not added any product or service information to TRADERS' RESOURCE. | |
Click here for more information about our publications!
Comments
Date:�03/09/14Rank:�4Comment:�

Request Information From Our Sponsors
- VectorVest, Inc.
- Executive Premier Workshop
- One-Day Options Course
- OptionsPro
- Retirement Income Workshop
- Sure-Fire Trading Systems (VectorVest, Inc.)
- Trading as a Business Workshop
- VectorVest 7 EOD
- VectorVest 7 RealTime/IntraDay
- VectorVest AutoTester
- VectorVest Educational Services
- VectorVest OnLine
- VectorVest Options Analyzer
- VectorVest ProGraphics v6.0
- VectorVest ProTrader 7
- VectorVest RealTime Derby Tool
- VectorVest Simulator
- VectorVest Variator
- VectorVest Watchdog
- StockCharts.com, Inc.
- Candle Patterns
- Candlestick Charting Explained
- Intermarket Technical Analysis
- John Murphy on Chart Analysis
- John Murphy's Chart Pattern Recognition
- John Murphy's Market Message
- MurphyExplainsMarketAnalysis-Intermarket Analysis
- MurphyExplainsMarketAnalysis-Visual Analysis
- StockCharts.com
- Technical Analysis of the Financial Markets
- The Visual Investor