HOT TOPICS LIST
- MACD
- Fibonacci
- RSI
- Gann
- ADXR
- Stochastics
- Volume
- Triangles
- Futures
- Cycles
- Volatility
- ZIGZAG
- MESA
- Retracement
- Aroon
INDICATORS LIST
LIST OF TOPICS
PRINT THIS ARTICLE
by Koos van der Merwe
With the market in a bull trend as the American economy recovers, researching a sound investment can be time consuming.
Position: Buy
Koos van der Merwe
Has been a technical analyst since 1969, and has worked as a futures and options trader with First Financial Futures in Johannesburg, South Africa.
PRINT THIS ARTICLE
ELLIOTT WAVE
Factset Research Systems, Inc.
01/16/14 02:42:04 PMby Koos van der Merwe
With the market in a bull trend as the American economy recovers, researching a sound investment can be time consuming.
Position: Buy
| FactSet Research Systems Inc. (FDS) provides integrated financial information and analytical applications to the global investment community. Financial institutions can offset the cost of a subscription with an investment in the stock. Based on the current dividend, an investment of just under $2M would yield enough to cover the $25k subscription fee, excluding taxes. Investing in the share can therefore reduce operating expenditure. The company's revenues are derived from subscriptions to services, content and financial applications. Approximately 80% of revenues are derived from investment management clients and the remainder is from investment banking firms. The company has a history of net revenue growth over 33 consecutive years with 17 consecutive years of earnings growth. Bloomberg L.P., Thomson Reuters Inc., and Standard & Poor's Capital IQ are main competitors. The company competes at the high end of the market. |

|
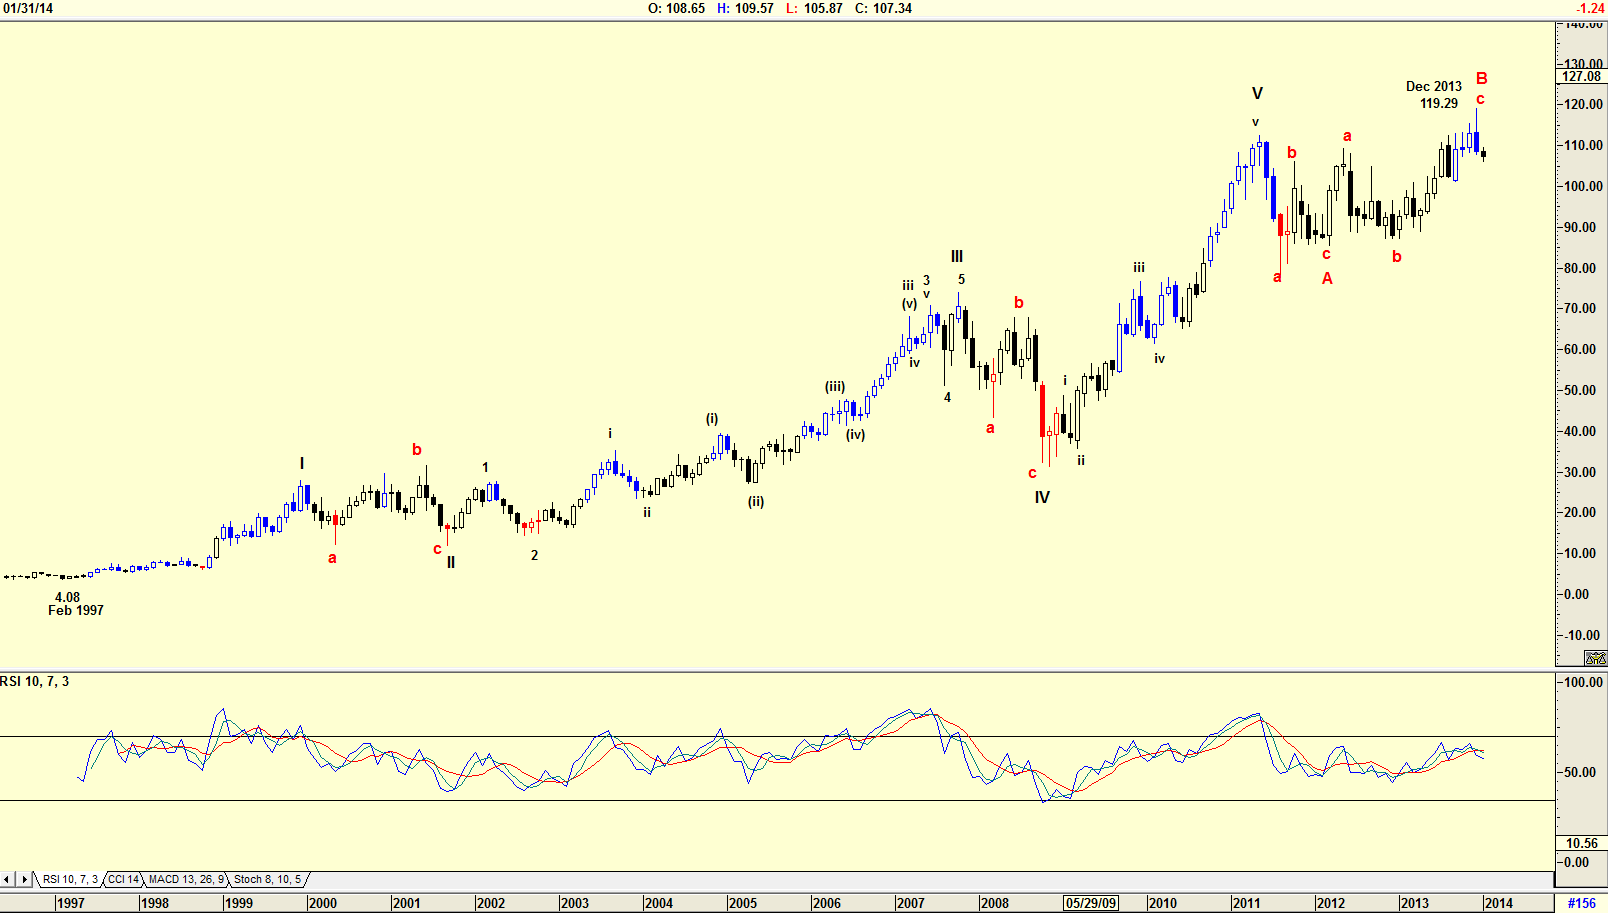
| Figure 1. Monthly chart with Elliott Wave count open to correction. |
| Graphic provided by: AdvancedGET. |
| |
| The chart in Figure 1 is a monthly chart showing how the price has risen from a low of $4.08 in 1997 to its present high of $119.29 by December 2013. The Elliott Wave count suggests that the share price should move down in a major WAVE C. This is confirmed by the RSI indicator which is showing weakness. |

|
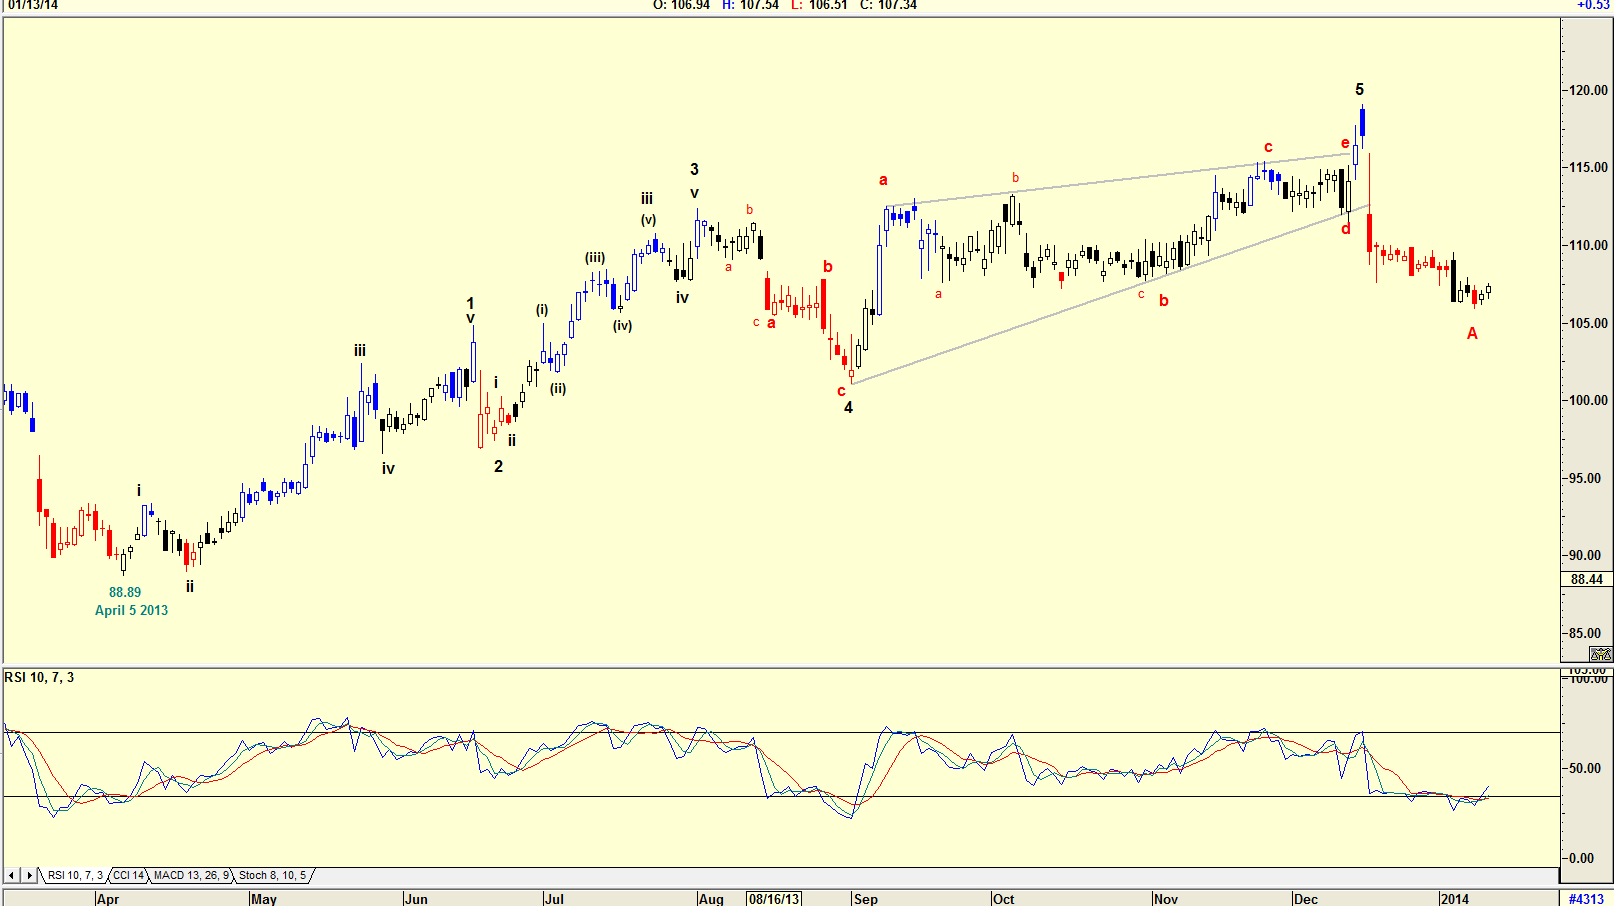
| Figure 2. Daily chart with Elliott Wave count. |
| Graphic provided by: AdvancedGET. |
| |
| The chart in Figure 2 is a daily chart with a rather complicated Elliott Wave count. The chart is suggesting that the share price should rise in what appears to be a WAVE B correction, but the Elliott Wave count could change because of the pennant formation that has formed for what I believe is Wave 5. The pattern looks like a pennant and has behaved like a pennant pattern should, breaking upwards to form a Wave 5 top. The fall to WAVE A was rapid, suggesting strong weakness in the overall market. Why? One should remember that the company analyzes and predicts the market. If at any time it presents a report suggesting future market weakness, the share price will drop as its customers follow its advice, even going so far as to sell at the top and buy at a bottom, collecting a quick profit. Should however, the wave count be correct, we could see the share price rise in a WAVE B correction. This could rise to retest the high of Wave 5. Note that the RSI indicator is at oversold levels and suggesting a buy. This is a share I would place on my watch list as a quick buy and sell. You could also go so far as to watch the share for an indication of future market direction. At the moment it is suggesting market strength, although as a WAVE B, the strength could be weak. |
Has been a technical analyst since 1969, and has worked as a futures and options trader with First Financial Futures in Johannesburg, South Africa.
| Address: | 3256 West 24th Ave |
| Vancouver, BC | |
| Phone # for sales: | 6042634214 |
| E-mail address: | petroosp@gmail.com |
Click here for more information about our publications!
PRINT THIS ARTICLE

Request Information From Our Sponsors
- StockCharts.com, Inc.
- Candle Patterns
- Candlestick Charting Explained
- Intermarket Technical Analysis
- John Murphy on Chart Analysis
- John Murphy's Chart Pattern Recognition
- John Murphy's Market Message
- MurphyExplainsMarketAnalysis-Intermarket Analysis
- MurphyExplainsMarketAnalysis-Visual Analysis
- StockCharts.com
- Technical Analysis of the Financial Markets
- The Visual Investor
- VectorVest, Inc.
- Executive Premier Workshop
- One-Day Options Course
- OptionsPro
- Retirement Income Workshop
- Sure-Fire Trading Systems (VectorVest, Inc.)
- Trading as a Business Workshop
- VectorVest 7 EOD
- VectorVest 7 RealTime/IntraDay
- VectorVest AutoTester
- VectorVest Educational Services
- VectorVest OnLine
- VectorVest Options Analyzer
- VectorVest ProGraphics v6.0
- VectorVest ProTrader 7
- VectorVest RealTime Derby Tool
- VectorVest Simulator
- VectorVest Variator
- VectorVest Watchdog
