HOT TOPICS LIST
- MACD
- Fibonacci
- RSI
- Gann
- ADXR
- Stochastics
- Volume
- Triangles
- Futures
- Cycles
- Volatility
- ZIGZAG
- MESA
- Retracement
- Aroon
INDICATORS LIST
LIST OF TOPICS
PRINT THIS ARTICLE
by Donald W. Pendergast, Jr.
After making new highs in 2013 and early 2014, the mighty Dow 30 Industrials appear to be headed south for a correction toward key support levels.
Position: N/A
Donald W. Pendergast, Jr.
Freelance financial markets writer and online publisher of the Trendzetterz.com S&P 500 Weekly Forecast service.
PRINT THIS ARTICLE
TECHNICAL ANALYSIS
DIA: Correction Underway - How Far Down?
01/15/14 04:15:23 PMby Donald W. Pendergast, Jr.
After making new highs in 2013 and early 2014, the mighty Dow 30 Industrials appear to be headed south for a correction toward key support levels.
Position: N/A
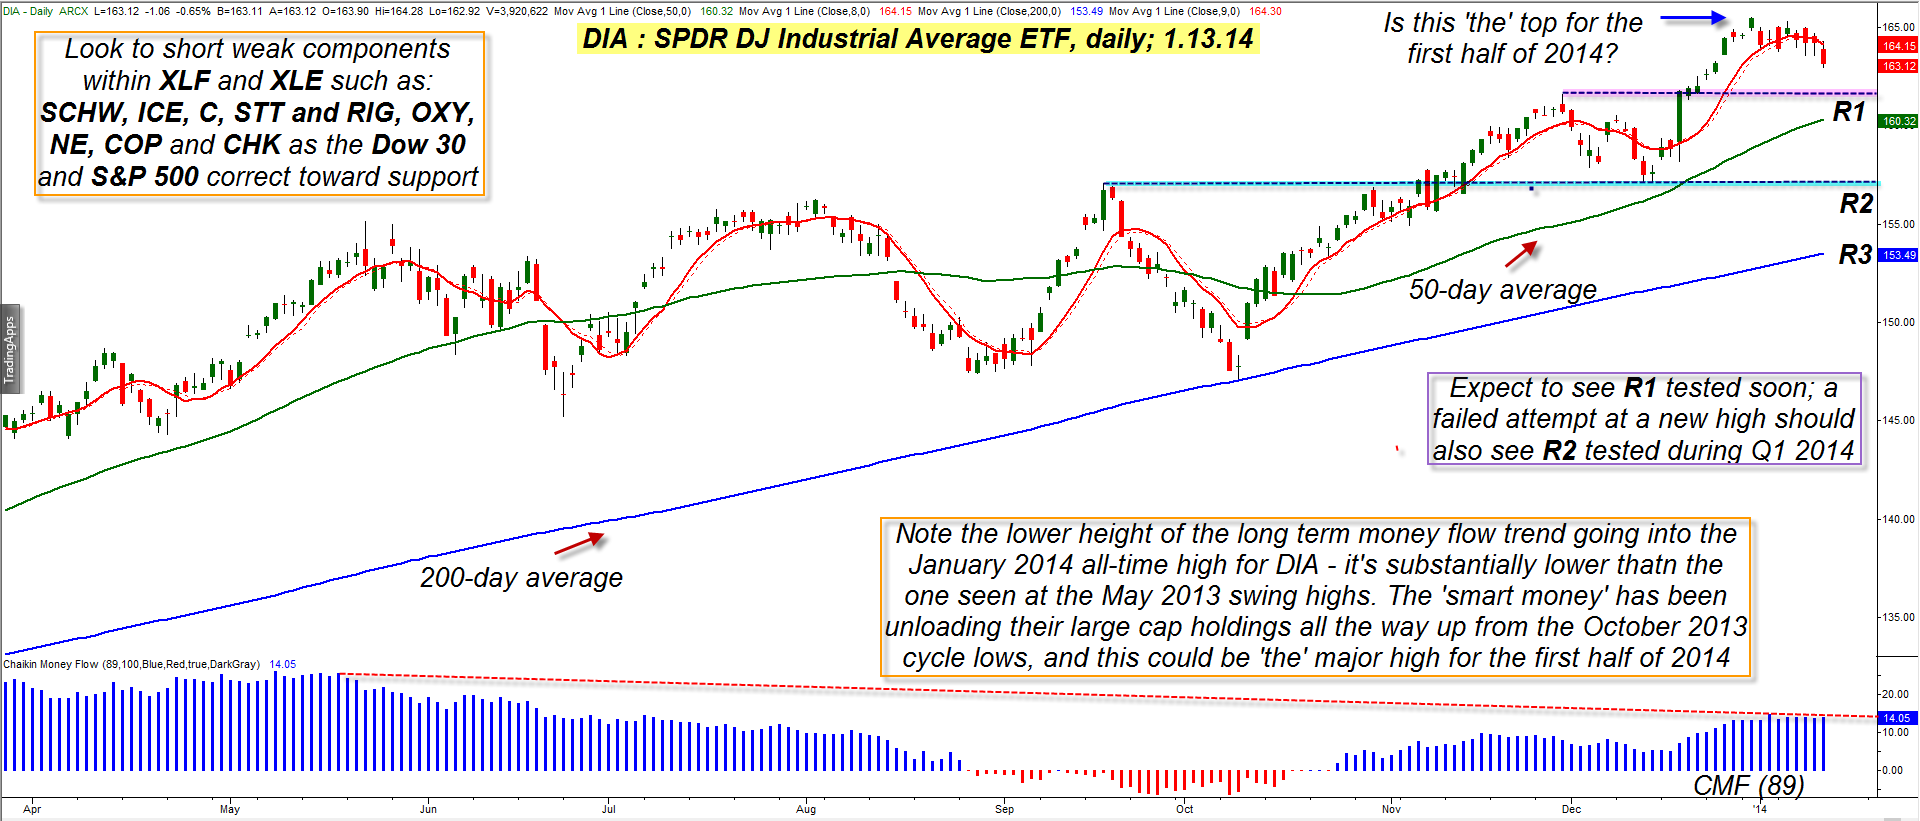
| It's been said that major market tops take longer to form than major market bottoms, and the long, progressive grind higher by the Dow 30 Industrials (DIA, .DJIA) since November 2012 could be the final phase of the enormous bull run seen in this key large cap index since March 2009. One of the major confirmations typically seen at major topping patterns is an ever-weakening long-term money flow trend and/or bearish money flow divergences with price action. We see that now in DIA and also in the other major stock index ETFs, which lends more credence to the probability of a notable correction during the first quarter of 2014. Here's a closer look at the daily chart dynamics of DIA (Figure 1). |

|
| Figure 1. The Dow 30 Industrials (DIA, .DJIA) turn the corner once again, heading southward. Expect support at R1 to be reached quickly; a failed run up to new highs afterward would be s strong signal that this market intends to test the support at R2 during the 1st quarter of 2014. |
| Graphic provided by: TradeStation. |
| |
| Long term bull markets are wonders to behold; they bounce back quickly even amidst times of turmoil in the world scene (remember the "flash crash" of May 2010 and the Eurozone debt crisis in the summer of 2011?) and in time easily recover all of the lost ground inflicted by such temporary interruptions. DIA took some hits during each of those mini-debacles, not to mention the "tapering" induced sell offs in the Summer/Fall of 2013 but still managed to claw its way to ever higher and even all-time highs afterward. No doubt the continued creation of QE monetary stimulus has been the major factor in all of the gains of the past five years, but as the Fed slowly starts to cut back on such long-running easing programs it's not surprising to see the markets correct from their recent all-time highs. The "smart money" players in the markets (hedge funds, mutual and pension funds and extremely wealthy, well-informed investors) have apparently been using the last rally phase in the Dow 30 to substantially lighten up on their long positions, selling out in a big way to the latecomers who believed that never-ending gains were in store for the markets heading into 2014. You can most clearly see this in the trend and height of the 89-day Chaikin Money flow histogram (CMF)(89); its height at the January 2014 all-time high was only 60% as high as it was when the market made a major cycle high in May 2013; this was like a fire alarm bell for those with eyes to see the charts and is now playing out before our eyes as the DIA, SPY, IWM, QQQ, and MDY all decline sharply on this second Monday in January 2014. DIA is getting especially hard hit; its next key support zones are as follows: R1 = 161.58 R2 = 157.07 Fibonacci 24% = 155.80 (of the entire run from Nov. 2102) R3 = 153.50 Fibonacci 38% = 150.00 (of the entire run from Nov. 2012) Given the speed of the current decline in DIA, R1 should be hit in short order; a failed rally from the 161.00/162.00 area should lead to a larger-scale decline down toward R2 near 157.00. Since the January 2014 high at 165.51 was likely an Elliott fifth wave high, the current sell-off is an A-wave of some magnitude; how this will unfold is unclear, but again, a failed rally toward new highs from R1 would seem to insure a test of support near at least R2 during the first quarter of 2014. The 50-day average, 200-day average and the two Fib levels are also levels to watch as potential supports. |

|
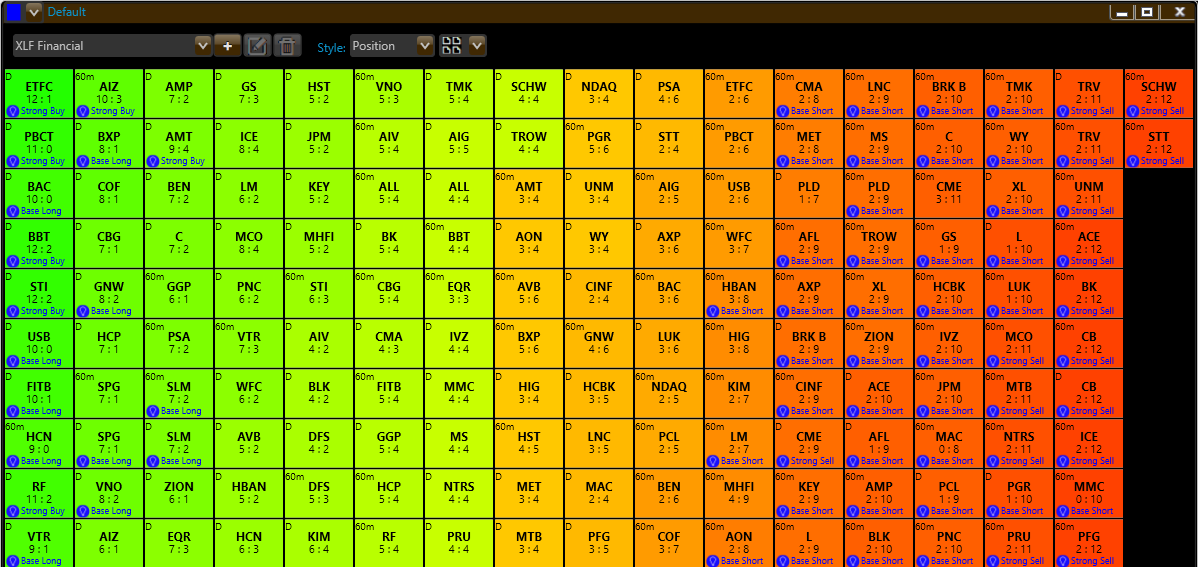
| Figure 2. Financial sector stocks begin to tip heavily into bearish trends on their respective 60, 120 and 240 minute time frames during trading on January 13, 2014. |
| Graphic provided by: Phantom Trader by KnowVera Research LLC. |
| |
| Checking the Trend Monitor within Phantom Trader (Figure 2), it appears that the stocks within XLE and XLF (SPDRS Energy and Financial sector ETFs) are the stocks most "turning red", with many of them starting to turn sharply lower. Stock tickers to watch for even more downside here include: XLE: RIG, OXY, NE, COP, CHK XLF: SCHW, ICE, C, STT Financials look vulnerable here, as they have been the stocks most blessed by the Fed's money-printing policies, but energies also look weak here. By contrast, stocks in the health care sector (XLV) and the utilities sector (XLU) are holding up much better. Look for short opportunities in the above-named energy and financial issues and consider hedging any health care or utility issues you already own with protective puts. Expect the first two quarters of 2014 to be a volatile roller coaster ride in the US stock market and make sure you pick your entry and exit points with great care even as you seek to keep your per trade risk small. Trade wisely until we meet here again. |
Freelance financial markets writer and online publisher of the Trendzetterz.com S&P 500 Weekly Forecast service.
| Title: | Market consultant and writer |
| Company: | Trendzetterz |
| Address: | 81 Hickory Hollow Drive |
| Crossville, TN 38555 | |
| Phone # for sales: | 904-303-4814 |
| Website: | trendzetterz.com |
| E-mail address: | support@trendzetterz.com |
Traders' Resource Links | |
| Trendzetterz has not added any product or service information to TRADERS' RESOURCE. | |
Click here for more information about our publications!
Comments

Request Information From Our Sponsors
- StockCharts.com, Inc.
- Candle Patterns
- Candlestick Charting Explained
- Intermarket Technical Analysis
- John Murphy on Chart Analysis
- John Murphy's Chart Pattern Recognition
- John Murphy's Market Message
- MurphyExplainsMarketAnalysis-Intermarket Analysis
- MurphyExplainsMarketAnalysis-Visual Analysis
- StockCharts.com
- Technical Analysis of the Financial Markets
- The Visual Investor
- VectorVest, Inc.
- Executive Premier Workshop
- One-Day Options Course
- OptionsPro
- Retirement Income Workshop
- Sure-Fire Trading Systems (VectorVest, Inc.)
- Trading as a Business Workshop
- VectorVest 7 EOD
- VectorVest 7 RealTime/IntraDay
- VectorVest AutoTester
- VectorVest Educational Services
- VectorVest OnLine
- VectorVest Options Analyzer
- VectorVest ProGraphics v6.0
- VectorVest ProTrader 7
- VectorVest RealTime Derby Tool
- VectorVest Simulator
- VectorVest Variator
- VectorVest Watchdog
