HOT TOPICS LIST
- MACD
- Fibonacci
- RSI
- Gann
- ADXR
- Stochastics
- Volume
- Triangles
- Futures
- Cycles
- Volatility
- ZIGZAG
- MESA
- Retracement
- Aroon
INDICATORS LIST
LIST OF TOPICS
PRINT THIS ARTICLE
by Koos van der Merwe
Traders are always looking for an indicator that will give them successful buy/sell signals. Here is a strategy that you can consider.
Position: Hold
Koos van der Merwe
Has been a technical analyst since 1969, and has worked as a futures and options trader with First Financial Futures in Johannesburg, South Africa.
PRINT THIS ARTICLE
ENVELOPES
An Indicator To Look At
01/15/14 04:23:26 PMby Koos van der Merwe
Traders are always looking for an indicator that will give them successful buy/sell signals. Here is a strategy that you can consider.
Position: Hold
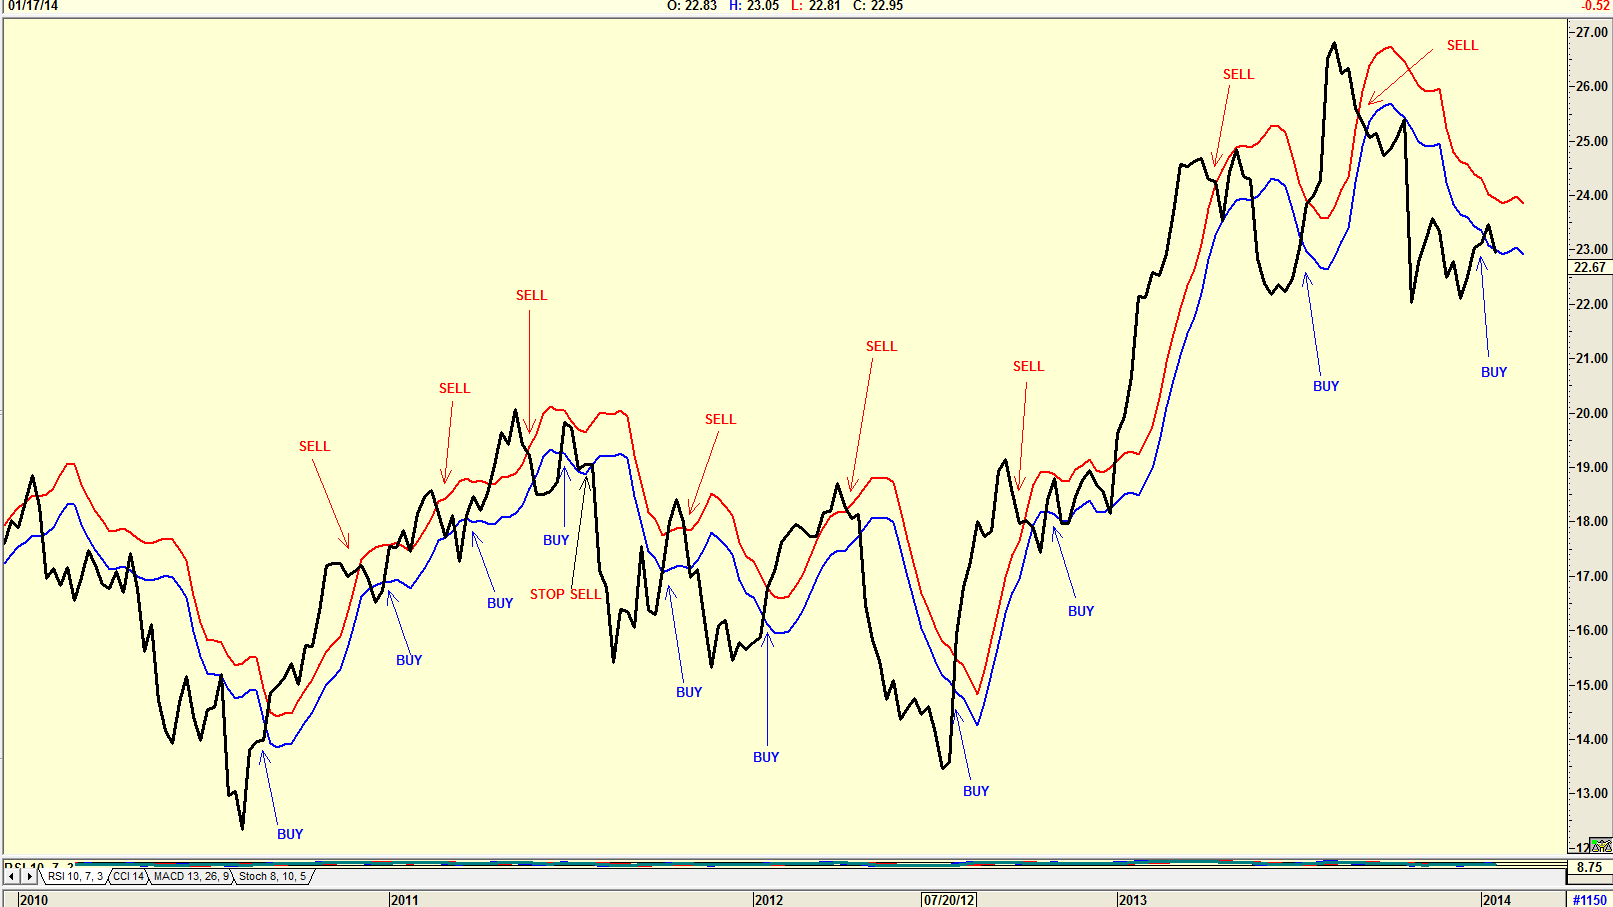
| We all know about Wells Wilder's RSI indicator, a popular indicator and one that I always watch. We also know the many other indicators that have become popular, from stochastics to the predictive and successful indicators introduced in the article by John F Ehlers in the January 2014 issue of Stocks & Commodities. Here is a simple indicator that has proved to be successful in telling me what share to look at for a future buy or sell. The indicator is a 6-period exponential moving average (EMA) of the high of 4 periods ago, offset by 2% positive and 2% negative. A buy signal is given when the closing price breaks above the lower band, and a sell signal is given when the price falls below the upper band. A trailing stop loss can be applied (not shown on the charts below) if necessary. I have found that when I apply the strategy to a weekly chart I get a good idea of what to expect from the future movement of a stock. |

|
| Figure 1. Weekly chart showing BUY and SELL signals. |
| Graphic provided by: AdvancedGET. |
| |
| The chart in Figure 1 is a weekly chart of Symantec Corp showing the buy/sell signals. Simply eyeballing the chart shows that the strategy will return a profit. The chart shows one stop sell signal, where the price gave a buy signal when it broke above the lower band line, but soon after gave a stop sell signal when it broke downward through the lower band line. |

|
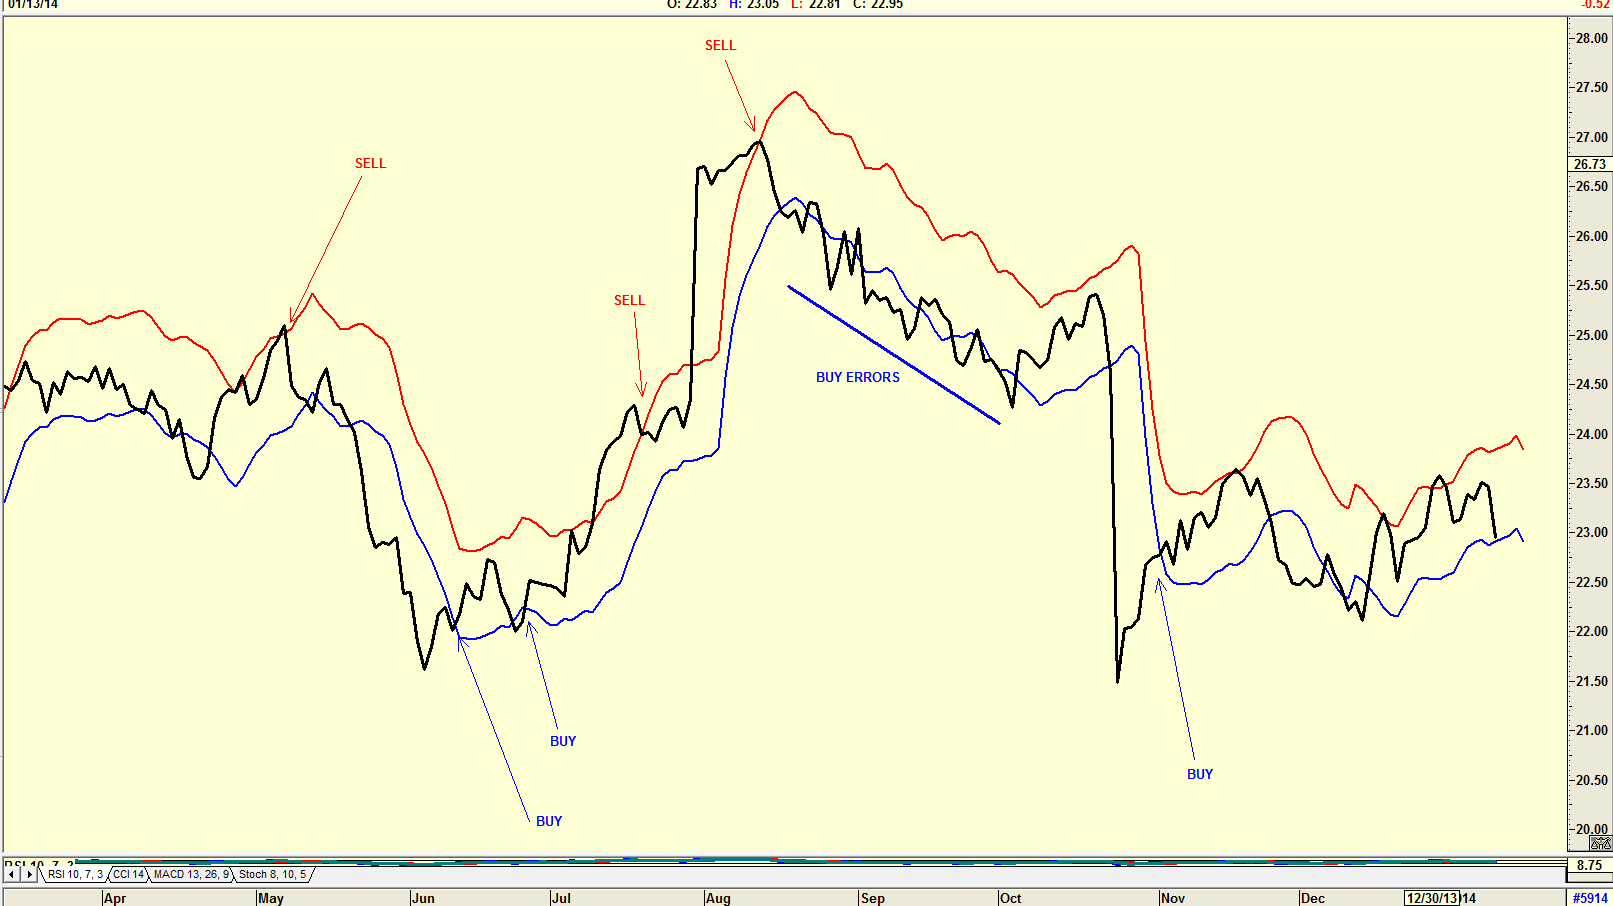
| Figure 2. Daily Chart showing BUY and SELL signals but also showing stop errors. |
| Graphic provided by: AdvancedGET. |
| |
| Looking at the daily chart in Figure 2, you can see why a weekly chart is the preferred chart on which to run the indicator. The buy errors shown on the chart show how buy signals were given quickly followed by stop loss signals as the price continued to fall. Admittedly, you can reduce this error by reducing the % offset, but this will then delay the buy sell signals given. Buying or selling stocks based on a weekly indicator is not the answer for trading, but it can be the answer for longer term investing. This is a strategy worth considering and playing with, especially in bringing a stock to your attention. |
Has been a technical analyst since 1969, and has worked as a futures and options trader with First Financial Futures in Johannesburg, South Africa.
| Address: | 3256 West 24th Ave |
| Vancouver, BC | |
| Phone # for sales: | 6042634214 |
| E-mail address: | petroosp@gmail.com |
Click here for more information about our publications!
Comments

Request Information From Our Sponsors
- StockCharts.com, Inc.
- Candle Patterns
- Candlestick Charting Explained
- Intermarket Technical Analysis
- John Murphy on Chart Analysis
- John Murphy's Chart Pattern Recognition
- John Murphy's Market Message
- MurphyExplainsMarketAnalysis-Intermarket Analysis
- MurphyExplainsMarketAnalysis-Visual Analysis
- StockCharts.com
- Technical Analysis of the Financial Markets
- The Visual Investor
- VectorVest, Inc.
- Executive Premier Workshop
- One-Day Options Course
- OptionsPro
- Retirement Income Workshop
- Sure-Fire Trading Systems (VectorVest, Inc.)
- Trading as a Business Workshop
- VectorVest 7 EOD
- VectorVest 7 RealTime/IntraDay
- VectorVest AutoTester
- VectorVest Educational Services
- VectorVest OnLine
- VectorVest Options Analyzer
- VectorVest ProGraphics v6.0
- VectorVest ProTrader 7
- VectorVest RealTime Derby Tool
- VectorVest Simulator
- VectorVest Variator
- VectorVest Watchdog
