

HOT TOPICS LIST
- MACD
- Fibonacci
- RSI
- Gann
- ADXR
- Stochastics
- Volume
- Triangles
- Futures
- Cycles
- Volatility
- ZIGZAG
- MESA
- Retracement
- Aroon
INDICATORS LIST
LIST OF TOPICS
PRINT THIS ARTICLE
by Kevin Hopson
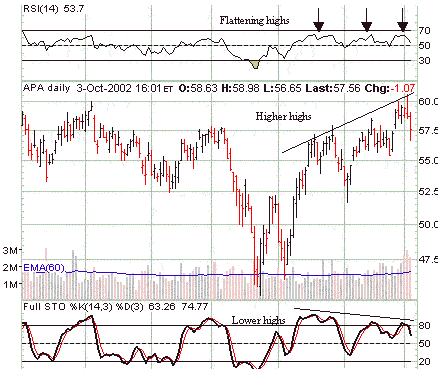
Though Apache Corp. (APA) recently hit a new 52-week high, the relative strength index (RSI) and stochastics pointed to a potential top in the stock price.
Position: Hold
Kevin Hopson
Kevin has been a technical analyst for roughly 10 years now. Previously, Kevin owned his own business and acted as a registered investment advisor, specializing in energy. He was also a freelance oil analyst for Orient Trading Co., a commodity futures trading firm in Japan. Kevin is currently a freelance writer.
PRINT THIS ARTICLE
TECHNICAL INDICATORS
Relative Strength Index and Stochastics Can Help Confirm Tops
10/04/02 08:53:45 AMby Kevin Hopson
Though Apache Corp. (APA) recently hit a new 52-week high, the relative strength index (RSI) and stochastics pointed to a potential top in the stock price.
Position: Hold
| Predicting short-term tops can help maximize profits for traders. A couple of measures that I use in determining potential tops are option open interest and chart resistance levels. For example, if XYZ Company has a significant amount of call open interest at a particular strike price, the stock will likely find resistance there. The reason being that sellers of these call options want to keep the stock "out-of-the-money" in order to keep their premium. |
| To do this, they would sell shares of XYZ as it approaches the specified strike price, thus putting downside pressure on the stock. This method works even better when there is chart resistance at the same price level. For example, this can happen at a prior top, significant moving average, or long-term downtrend line. Spotting situations like this - where all of the pieces come together - are rare but when it occurs, it makes for a great shorting opportunity and/or exit point for traders. |
|
| Graphic provided by: Stockcharts.com. |
| |
| Is this guaranteed to work? Of course not. More times than not, I have been successful in utilizing this strategy. However, just because there is significant resistance at a certain price level does not mean that the stock cannot overcome it. As a result, I like to look at the relative strength index (RSI) and stochastics to help confirm the possibility of a short-term top. |
| Primarily you want to look at whether or not the RSI and stochastics are making higher highs along with the stock price. As you can see in the daily chart for Apache Corp. (APA), the stock broke a spread quadruple top in the $57.00 to $58.00 range last month and proceeded to run-up to the $60.00 level. However, this is not only the site of significant call open interest, but is also the site of a spread triple top formation dating back to May of last year. |
| In other words, the $60.00 to $61.00 range has capped prices for the last 17 months. Did this - alone - mean that Apache was setting up for a short-term correction? No, but the RSI and stochastics made me more confident that this would be the end result. More specifically, while Apache Corp. proceeded to hit a new 52-week high above the $60.00 level, the RSI and stochastics did not make new highs. As a result, these indicators told me that the recent rally was going to fail. As you can see per the chart, this is exactly what happened. |
Kevin has been a technical analyst for roughly 10 years now. Previously, Kevin owned his own business and acted as a registered investment advisor, specializing in energy. He was also a freelance oil analyst for Orient Trading Co., a commodity futures trading firm in Japan. Kevin is currently a freelance writer.
| Glen Allen, VA | |
| E-mail address: | hopson_1@yahoo.com |
Click here for more information about our publications!
Comments
Date:�10/08/02Rank:�4Comment:�

Request Information From Our Sponsors
- VectorVest, Inc.
- Executive Premier Workshop
- One-Day Options Course
- OptionsPro
- Retirement Income Workshop
- Sure-Fire Trading Systems (VectorVest, Inc.)
- Trading as a Business Workshop
- VectorVest 7 EOD
- VectorVest 7 RealTime/IntraDay
- VectorVest AutoTester
- VectorVest Educational Services
- VectorVest OnLine
- VectorVest Options Analyzer
- VectorVest ProGraphics v6.0
- VectorVest ProTrader 7
- VectorVest RealTime Derby Tool
- VectorVest Simulator
- VectorVest Variator
- VectorVest Watchdog
- StockCharts.com, Inc.
- Candle Patterns
- Candlestick Charting Explained
- Intermarket Technical Analysis
- John Murphy on Chart Analysis
- John Murphy's Chart Pattern Recognition
- John Murphy's Market Message
- MurphyExplainsMarketAnalysis-Intermarket Analysis
- MurphyExplainsMarketAnalysis-Visual Analysis
- StockCharts.com
- Technical Analysis of the Financial Markets
- The Visual Investor