HOT TOPICS LIST
- MACD
- Fibonacci
- RSI
- Gann
- ADXR
- Stochastics
- Volume
- Triangles
- Futures
- Cycles
- Volatility
- ZIGZAG
- MESA
- Retracement
- Aroon
INDICATORS LIST
LIST OF TOPICS
PRINT THIS ARTICLE
by Koos van der Merwe
The price of gold has fallen dramatically over the past year. Is it time to start loading up on gold shares?
Position: Sell
Koos van der Merwe
Has been a technical analyst since 1969, and has worked as a futures and options trader with First Financial Futures in Johannesburg, South Africa.
PRINT THIS ARTICLE
ELLIOTT WAVE
Looking At A Gold Nibble
01/15/14 04:07:38 PMby Koos van der Merwe
The price of gold has fallen dramatically over the past year. Is it time to start loading up on gold shares?
Position: Sell
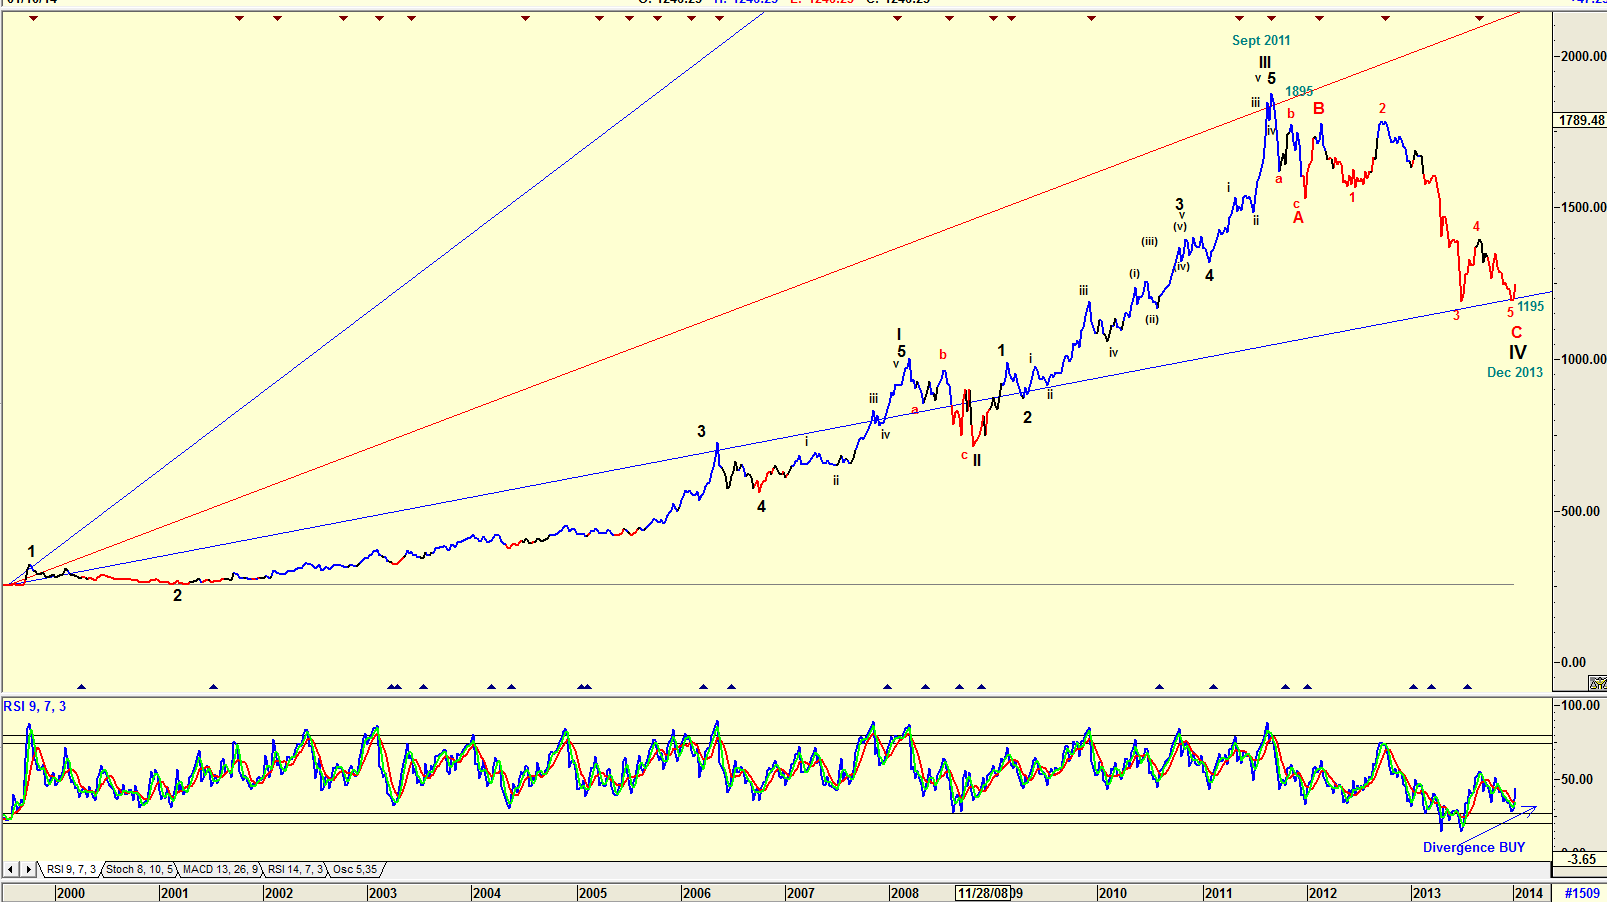
| The rule is, "buy when everyone else is selling," but let's face it, it takes a great deal of guts to do that. With the gold price falling dramatically from a high of 1895 in September 2011 to 1195 in December 2013 and a retest of that level in December 2013, the bears in the gold price are having a field day. Can the price of gold fall further? Probably, but it does appear to be forming a base that is tempting to bottom pickers. |

|
| Figure 1. Weekly Chart of the London Gold price. |
| Graphic provided by: AdvancedGET. |
| |
| The chart in Figure 1 is a weekly chart of the London gold price, with a Gann Fan and Elliott Wave count. Note how the price has fallen from a high on the 1x1 Gann fan line to the 2x1 fan line in what an Elliott Wave count suggests is a WAVE C bottom of a WAVE IV correction. If this wave count is correct, then it suggests that the price of gold could start rising to new highs but it will take many years, as the start of WAVE V could be slow. Note the divergence buy signal given by the RSI indicator. The Gann fan is suggesting that indeed, a bottom has formed. As to the Elliott Wave count, you should never forget that an Elliott Wave count is simply a signpost in the wilderness that can change at the next signpost a little way down the road. So, betting on the Gann fan and hoping that the Elliott Wave signpost will be a long way down the road, is it time to start loading up on gold shares? "Loading up," no, but "nibbling," yes. |

|
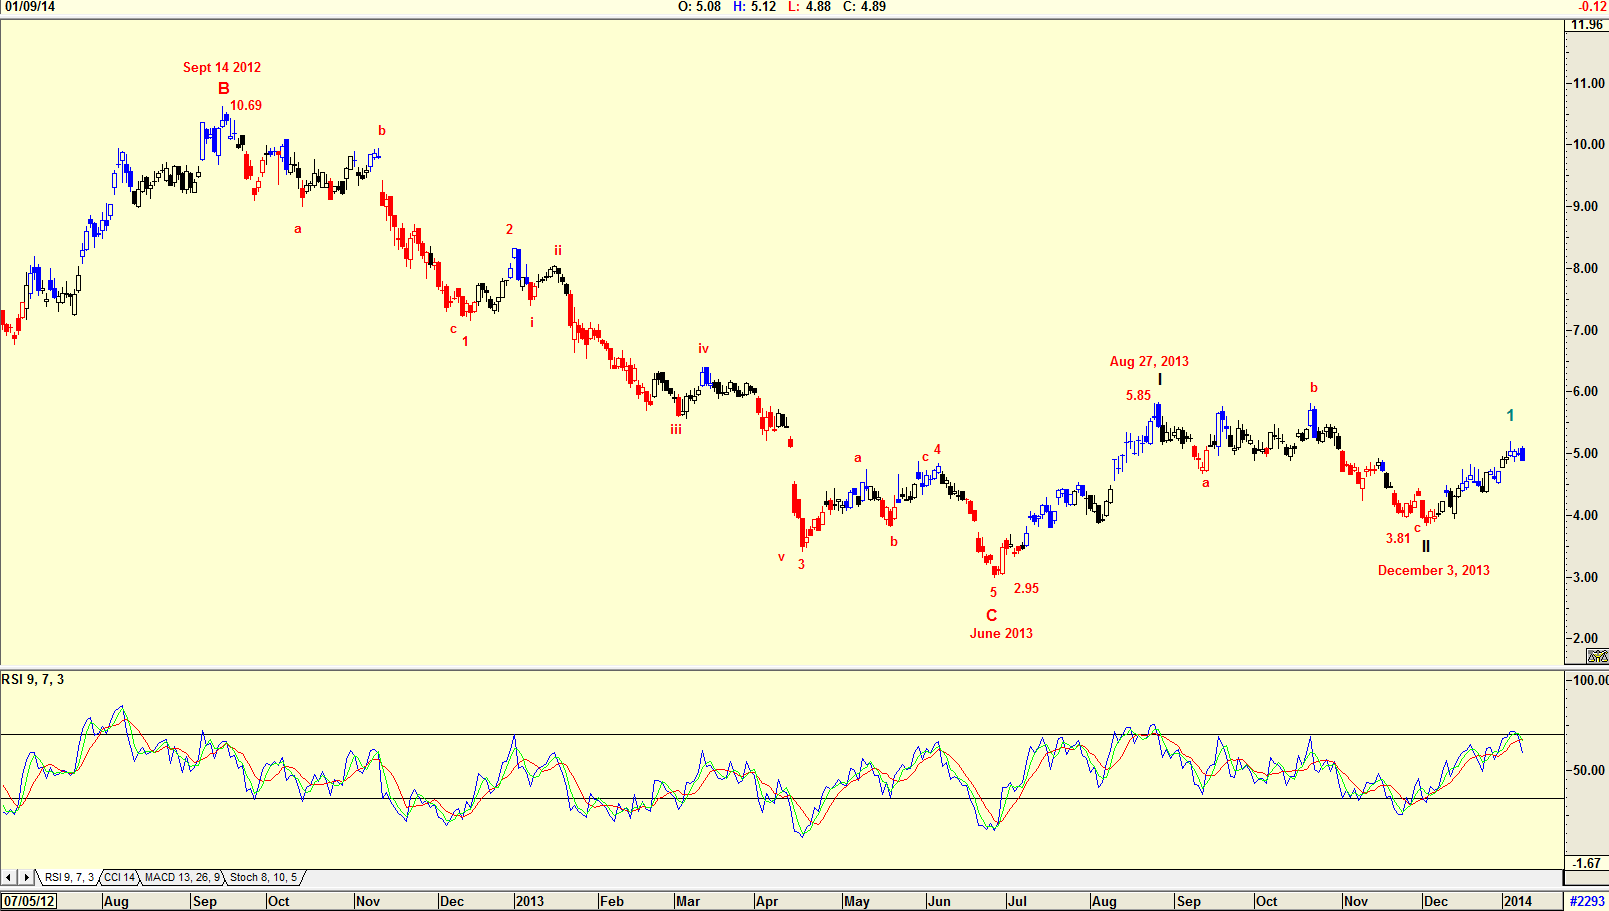
| Figure 2. Daily chart of Osisko Mining Corp. |
| Graphic provided by: AdvancedGET. |
| |
| One share that has captured my attention is Osisko Mining Corp. (OSK-T). The corporation, is a mid-tier gold producer based in Montreal, Quebec focused on acquiring, exploring, developing, and mining gold properties. The Canadian Malartic deposit owned by the corporation currently represents one of the biggest gold reserves in production in Canada. The chart in Figure 2 shows how the share price has fallen from a high of $10.69 in September 2012 to a low of $2.95 by June 2013. The share price then rose to $5.85 by August 27, 2013 and then fell as the gold price fell to a low of $3.81 by December 2013. Where the Elliott Wave pattern in the weekly chart of Figure 1 suggests an Elliott Wave count with WAVE C bottom, the daily chart of Osisko Mining did not fall to test the low of June 2013. This is what brought the share to my attention — the strength shown as the gold price fell to retest its lows. The RSI indicator has however given a sell signal, suggesting that the price should fall to retest the low of $3.81. That may trigger a new buy signal. I would not be a buyer of Osisko Mining Corp at the moment, but the share does look interesting for a bottom nibble and a quick profit as and when the gold price starts recovering. |
Has been a technical analyst since 1969, and has worked as a futures and options trader with First Financial Futures in Johannesburg, South Africa.
| Address: | 3256 West 24th Ave |
| Vancouver, BC | |
| Phone # for sales: | 6042634214 |
| E-mail address: | petroosp@gmail.com |
Click here for more information about our publications!
PRINT THIS ARTICLE

Request Information From Our Sponsors
- VectorVest, Inc.
- Executive Premier Workshop
- One-Day Options Course
- OptionsPro
- Retirement Income Workshop
- Sure-Fire Trading Systems (VectorVest, Inc.)
- Trading as a Business Workshop
- VectorVest 7 EOD
- VectorVest 7 RealTime/IntraDay
- VectorVest AutoTester
- VectorVest Educational Services
- VectorVest OnLine
- VectorVest Options Analyzer
- VectorVest ProGraphics v6.0
- VectorVest ProTrader 7
- VectorVest RealTime Derby Tool
- VectorVest Simulator
- VectorVest Variator
- VectorVest Watchdog
- StockCharts.com, Inc.
- Candle Patterns
- Candlestick Charting Explained
- Intermarket Technical Analysis
- John Murphy on Chart Analysis
- John Murphy's Chart Pattern Recognition
- John Murphy's Market Message
- MurphyExplainsMarketAnalysis-Intermarket Analysis
- MurphyExplainsMarketAnalysis-Visual Analysis
- StockCharts.com
- Technical Analysis of the Financial Markets
- The Visual Investor
