HOT TOPICS LIST
- MACD
- Fibonacci
- RSI
- Gann
- ADXR
- Stochastics
- Volume
- Triangles
- Futures
- Cycles
- Volatility
- ZIGZAG
- MESA
- Retracement
- Aroon
INDICATORS LIST
LIST OF TOPICS
PRINT THIS ARTICLE
by Donald W. Pendergast, Jr.
After dropping sharply in December 2013, shares of Ford Motor have rebounded back up to a key resistance zone.
Position: N/A
Donald W. Pendergast, Jr.
Freelance financial markets writer and online publisher of the Trendzetterz.com S&P 500 Weekly Forecast service.
PRINT THIS ARTICLE
GAPS
Ford Fills Gap
01/13/14 05:02:04 PMby Donald W. Pendergast, Jr.
After dropping sharply in December 2013, shares of Ford Motor have rebounded back up to a key resistance zone.
Position: N/A
| As is almost always the case at major market tops or bottoms, the tell-tale signs of distribution or accumulation by the so-called "smart money" becomes clearly visible. Here's a look at how the big money was responding as shares of Ford Motor (F) closed in on its recent multiyear highs — and what we might expect to see them do in the weeks and months ahead now that the stock has entered a major corrective phase. |

|
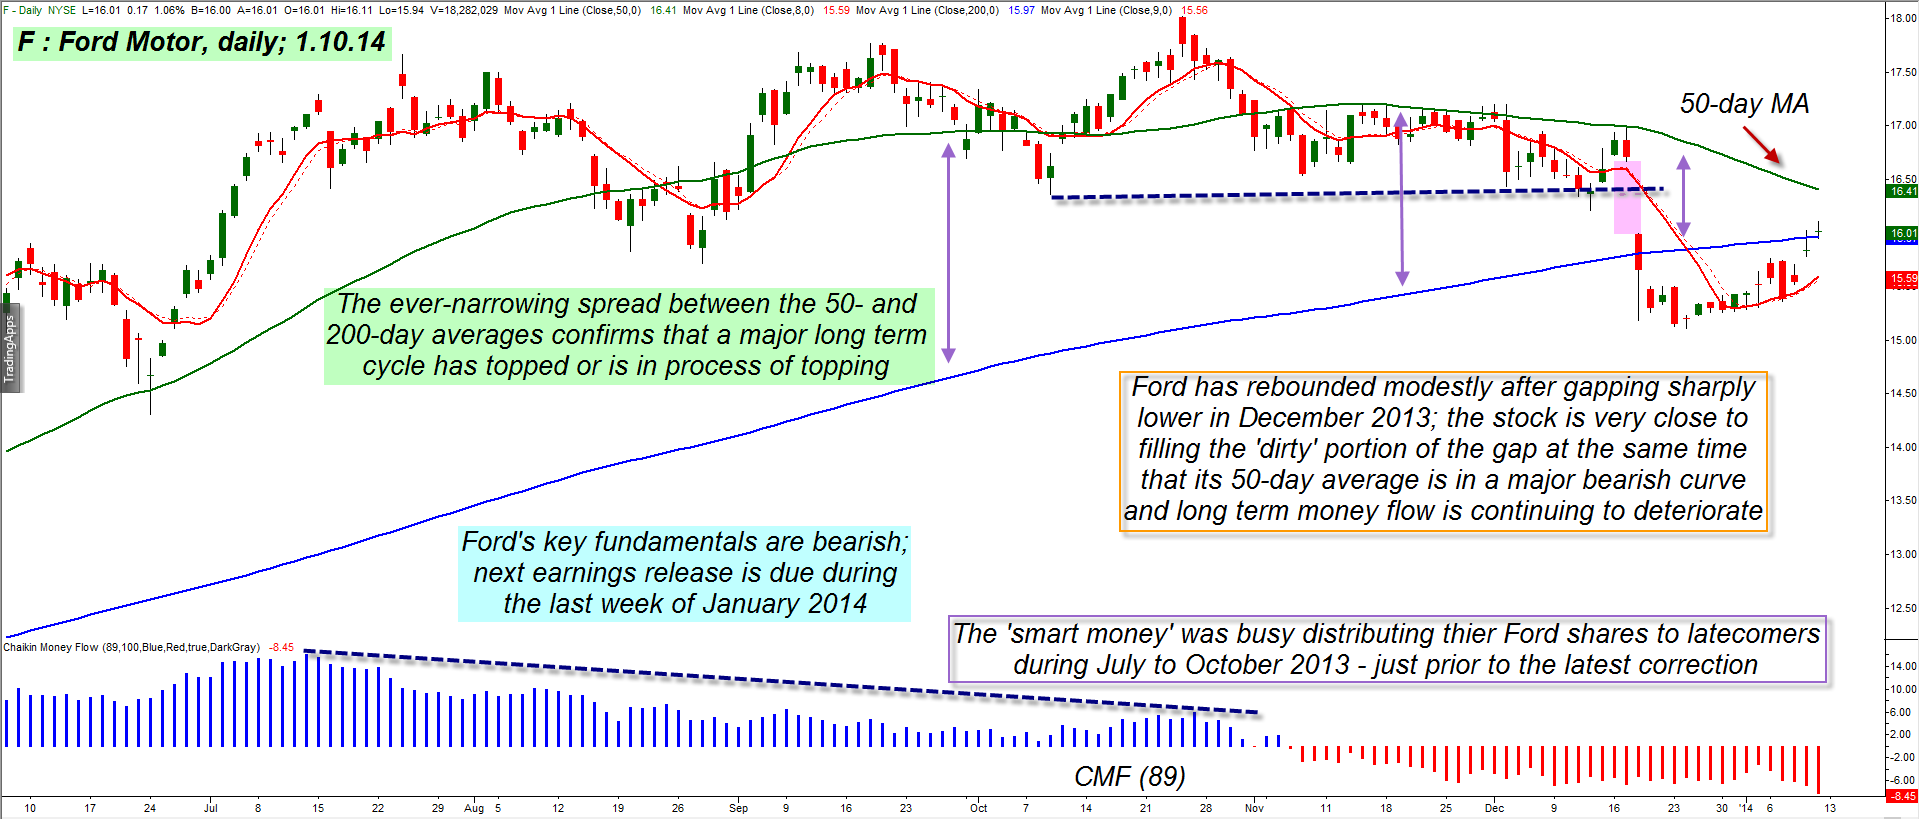
| Figure 1. Ford Motor (F) first saw its long term money flow decline even as new highs were being made, after which the spread between its 50- and 200-day averages began to narrow; finally, a large bearish gap and break of key support confirmed the change in trend from bull to bear. |
| Graphic provided by: TradeStation. |
| |
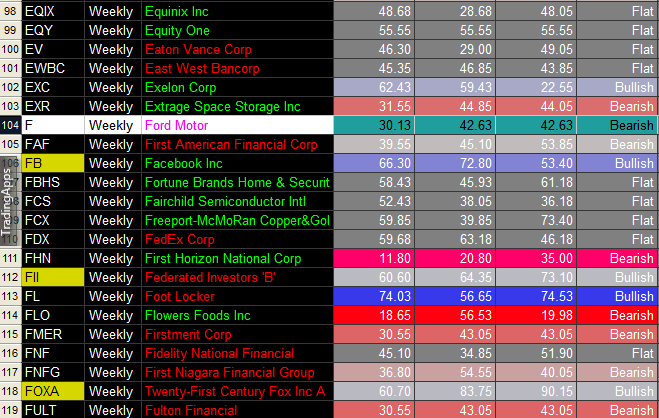
| What a great run shares of Ford Motor had coming out of the major March 2009, post-crash lows. The stock increased by more than ten fold until it peaked in January 2011 and then corrected hard again before mounting a fresh rally in midsummer of 2012, one that took it up toward the January 2011 highs of 18.97 again; the rally stalled out at 18.02 on October 25, 2013 and Ford is now down more than 10% from that major high (Figure 1). Of major importance is that during the second post-crash rally leg is that the "smart money" (mutual funds, pro traders/investors, hedge funds, etc.) were steadily selling out of their long positions between mid-July and late October 2013 even as the stock grinded higher. Just look at the downward trend of the 89-day Chaikin Money flow histogram (CMF)(89) to see how this was easily discernible to an educated technician's eyes. Wise traders and chartists would also have been taking note of the narrowing spread between the simple 50- and 200-day moving averages, as this is a tip-off that a major cycle high is forming, one that usually precedes a significant correction. Of course, a trader still needs a timing mechanism to begin profiting as a stock turns bearish, but for those who had long-term holdings in Ford, those two chart dynamics served up plenty of advance notice that the stock had a high probability of turning lower in the near future. And turn south it did, as key support levels were soon broken with the large overnight gap on December 18, 2013. This sort of price action doesn't guarantee that Ford has entered a long-term bear market, but many bear markets do begin with similar money flow, cycle, and bearish gap patterns like this one you see here. To add insult to injury, Ford's key fundamentals have also turned ugly (as have many other big names in the S&P 500 index (.SPX)); in fact, just among component stocks that begin with the letter 'F', only five are bullish, eight are bearish (including Ford Motor) and nine are flat (neutral). And that same bias spans the entire universe of .SPX components (America's 500 largest capitalization stocks), FYI. Scan your own charts of .SPX components using these two simple money flow and moving average indicators and see how many big stocks are also giving evidence of bearish trend changes — it will be time well-spent. |

|
| Figure 2. Ford Motor's fundamentals are weakening on a quarterly basis, with the Fundamental Score Indicator giving the stock a bearish rating. Of the 22 S&P 500 component stocks shown here, only 5 have bullish fundamental scores. |
| Graphic provided by: TradeStation. |
| Graphic provided by: Fundamental Score Indicator from TradeStation 9.1. |
| |
| At the moment, Ford shares are rising into a major resistance convergence zone formed by the following: 1. A declining 50-day average. 2. The lower portion of December's open gap. 3. A declining eight-week moving average. The stock is also right near its 200-day average (went a little above it) at a time when the long-term money flow is actually weakening. This is another sign that shows the smart money is not on board this bear bounce and that larger-scale declines are likely in the weeks ahead. Should more declines occur and the 50-day average crosses below the 200-day average, a "death cross" will have been completed, and a long-term bear market confirmed. Moving averages of this length are lagging indicators, so be aware that by the time that cross occurs that a good part of the stock's anticipated decline may already have been completed; in such a case, use shorter-term daily chart entry triggers to help you pinpoint further short entries in this or other weak .SPX components. Make sure any shorts you enter have poor fundamentals and weak relative strength vs. the major US stock indexes and keep your trade risks modest at all times. Trade wisely until we meet here again. |
Freelance financial markets writer and online publisher of the Trendzetterz.com S&P 500 Weekly Forecast service.
| Title: | Market consultant and writer |
| Company: | Trendzetterz |
| Address: | 81 Hickory Hollow Drive |
| Crossville, TN 38555 | |
| Phone # for sales: | 904-303-4814 |
| Website: | trendzetterz.com |
| E-mail address: | support@trendzetterz.com |
Traders' Resource Links | |
| Trendzetterz has not added any product or service information to TRADERS' RESOURCE. | |
Click here for more information about our publications!
Comments

|

Request Information From Our Sponsors
- StockCharts.com, Inc.
- Candle Patterns
- Candlestick Charting Explained
- Intermarket Technical Analysis
- John Murphy on Chart Analysis
- John Murphy's Chart Pattern Recognition
- John Murphy's Market Message
- MurphyExplainsMarketAnalysis-Intermarket Analysis
- MurphyExplainsMarketAnalysis-Visual Analysis
- StockCharts.com
- Technical Analysis of the Financial Markets
- The Visual Investor
- VectorVest, Inc.
- Executive Premier Workshop
- One-Day Options Course
- OptionsPro
- Retirement Income Workshop
- Sure-Fire Trading Systems (VectorVest, Inc.)
- Trading as a Business Workshop
- VectorVest 7 EOD
- VectorVest 7 RealTime/IntraDay
- VectorVest AutoTester
- VectorVest Educational Services
- VectorVest OnLine
- VectorVest Options Analyzer
- VectorVest ProGraphics v6.0
- VectorVest ProTrader 7
- VectorVest RealTime Derby Tool
- VectorVest Simulator
- VectorVest Variator
- VectorVest Watchdog
