

HOT TOPICS LIST
- MACD
- Fibonacci
- RSI
- Gann
- ADXR
- Stochastics
- Volume
- Triangles
- Futures
- Cycles
- Volatility
- ZIGZAG
- MESA
- Retracement
- Aroon
INDICATORS LIST
LIST OF TOPICS
PRINT THIS ARTICLE
by Chaitali Mohile
The current short-term downside move and the potential support are likely to make Clorox a good trading stock.
Position: N/A
Chaitali Mohile
Active trader in the Indian stock markets since 2003 and a full-time writer. Trading is largely based upon technical analysis.
PRINT THIS ARTICLE
SUPPORT & RESISTANCE
Is CLX An Attractive Stock?
01/13/14 04:55:26 PMby Chaitali Mohile
The current short-term downside move and the potential support are likely to make Clorox a good trading stock.
Position: N/A
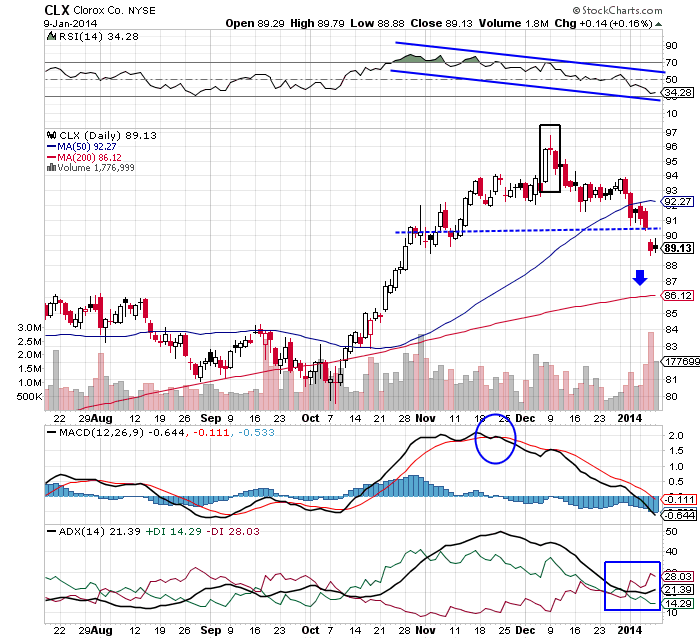
| A bullish breakout rally of Clorox (CLX) was terminated by an evening star candlestick pattern formed at the top near 96 levels (Figure 1). After this bearish reversal candlestick formation, the price rally changed its direction. Gradually, CLX formed a rounded-top, a bearish reversal pattern that has already breached the 50-day moving average support. The blue line seen in Figure 1 shows the support formed by the previous highs and lows of the bullish rally. The stock has violated this psychological support with a small gap down, suggesting increasing bearish pressure on the rally. |
| A highly overheated uptrend in late November 2013 indicated a possibility of a trend reversal, which may have strengthened the rounded-top formation. The relative strength index (RSI)(14) descended from the overbought region, and the moving average convergence/divergence (MACD)(12,26,9) underwent a bearish crossover in positive territory. Hence these indicators suggested bearish reversal for CLX. Eventually, the bearish breakout occurred on the price chart, reversing the uptrend. Currently we can see the ADX(14) reflecting a developing downtrend, an oversold RSI(14) with enough room to move downwards, and the MACD(12,26,9) ready to plunge in negative territory in Figure 1. Thus, the intermediate downside rally would continue its journey toward the 200-day moving average (MA) support. |
|
| FIGURE 1: CLX, DAILY. |
| Graphic provided by: StockCharts.com. |
| |
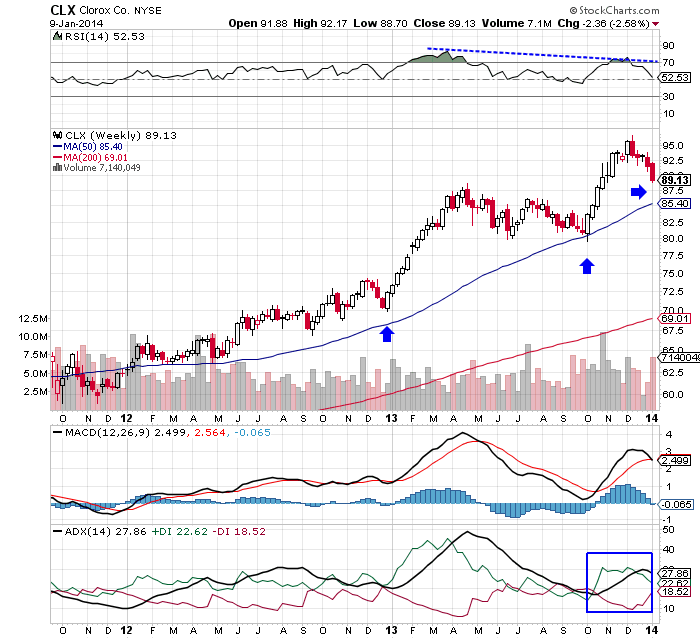
| According to the weekly time frame chart, CLX is forming a series of higher highs and lows with the support of the 50-day MA (Figure 2). During the bullish rally, the descending price movements established support at the moving average, resuming the previous upwards rally. Earlier, the stock had plunged from the peak at 89 levels due to the bearish reversal indications by the indicators. Currently, though, the MACD(12,26,9) and ADX(14) are in a bullish zone, the RSI(14) is showing negative divergence toward the price rally. Therefore, the descending stock that has reached closer to the moving average support would complete the formation of higher highs and lows. |
|
| FIGURE 2: CLX, WEEKLY. |
| Graphic provided by: StockCharts.com. |
| |
| Considering the previous price movements of CLX, we can anticipate that the price movement would follow similar patterns after establishing the support at the 50-day MA. CLX would once again begin a bullish journey. This would be a good low risk buying opportunity for traders and investors. However, traders should watch for the confirmed buying signals from the technical indicators. |
| The current downward move is a short-term selling trade. Since CLX may have already covered half of this downtrend, traders cannot board the rally at these levels. Therefore, those holding short positions can continue the trade with the target of 50-day MA support. Later, CLX is likely to begin a fresh upward rally. Hence CLX is one of the stocks that could be suitable for sellers and buyers in one single long-term rally. |
Active trader in the Indian stock markets since 2003 and a full-time writer. Trading is largely based upon technical analysis.
| Company: | Independent |
| Address: | C1/3 Parth Indraprasth Towers. Vastrapur |
| Ahmedabad, Guj 380015 | |
| E-mail address: | chaitalimohile@yahoo.co.in |
Traders' Resource Links | |
| Independent has not added any product or service information to TRADERS' RESOURCE. | |
Click here for more information about our publications!
PRINT THIS ARTICLE

Request Information From Our Sponsors
- StockCharts.com, Inc.
- Candle Patterns
- Candlestick Charting Explained
- Intermarket Technical Analysis
- John Murphy on Chart Analysis
- John Murphy's Chart Pattern Recognition
- John Murphy's Market Message
- MurphyExplainsMarketAnalysis-Intermarket Analysis
- MurphyExplainsMarketAnalysis-Visual Analysis
- StockCharts.com
- Technical Analysis of the Financial Markets
- The Visual Investor
- VectorVest, Inc.
- Executive Premier Workshop
- One-Day Options Course
- OptionsPro
- Retirement Income Workshop
- Sure-Fire Trading Systems (VectorVest, Inc.)
- Trading as a Business Workshop
- VectorVest 7 EOD
- VectorVest 7 RealTime/IntraDay
- VectorVest AutoTester
- VectorVest Educational Services
- VectorVest OnLine
- VectorVest Options Analyzer
- VectorVest ProGraphics v6.0
- VectorVest ProTrader 7
- VectorVest RealTime Derby Tool
- VectorVest Simulator
- VectorVest Variator
- VectorVest Watchdog