

HOT TOPICS LIST
- MACD
- Fibonacci
- RSI
- Gann
- ADXR
- Stochastics
- Volume
- Triangles
- Futures
- Cycles
- Volatility
- ZIGZAG
- MESA
- Retracement
- Aroon
INDICATORS LIST
LIST OF TOPICS
PRINT THIS ARTICLE
by Matt Blackman
Since hitting a low of $17.55 on September 4, 2012, Facebook has been on a tear. But it's now at a key resistance level that could form a top.
Position: N/A
Matt Blackman
Matt Blackman is a full-time technical and financial writer and trader. He produces corporate and financial newsletters, and assists clients in getting published in the mainstream media. He is the host of TradeSystemGuru.com. Matt has earned the Chartered Market Technician (CMT) designation. Find out what stocks and futures Matt is watching on Twitter at www.twitter.com/RatioTrade
PRINT THIS ARTICLE
DOUBLE TOPS
Facebook Hits Key Resistance
01/10/14 01:11:58 PMby Matt Blackman
Since hitting a low of $17.55 on September 4, 2012, Facebook has been on a tear. But it's now at a key resistance level that could form a top.
Position: N/A
| According to the 2013 Stock Trader's Almanac, January is a pivotal month for stocks and it has developed two important indicators to help traders. One is called the First Five Days which says that as go the first five trading days of the year for the S&P 500 index, so goes the rest of the year. In the last 39 up signals, 33 years have ended positively for an accuracy rate of better than 84%. It has been less reliable in down years, with accuracy of just 48%. |
| More reliable however, is the January Barometer, which says that as January goes, so will go 2014. Thanks to a greater amount of data upon which to rely, it has been accurate 89% of the time since 1972. |
|
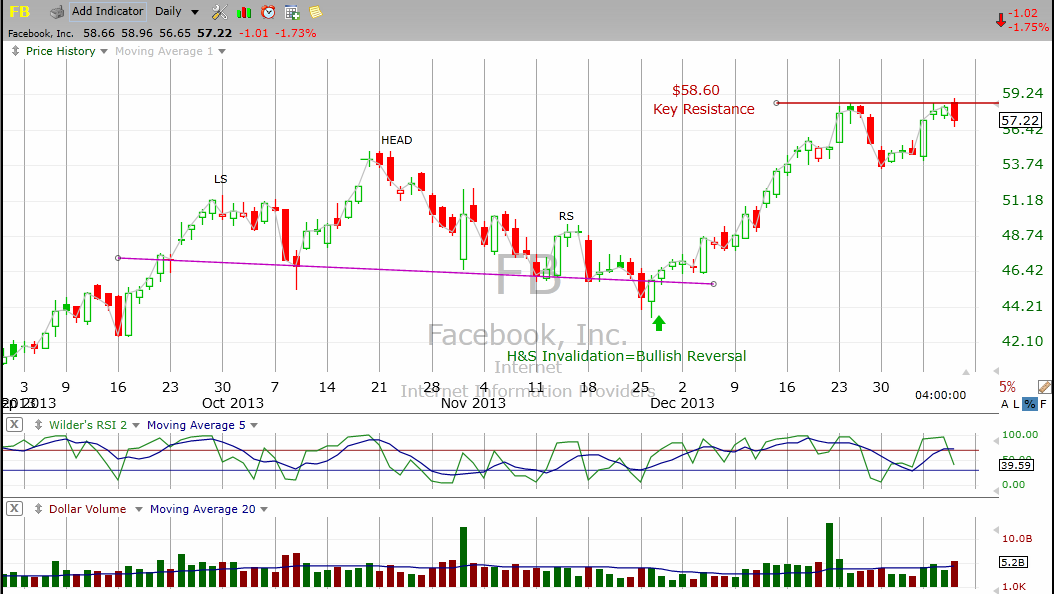
| Figure 1 � Daily chart of FB showing the bullish invalidation of the Head & Shoulders top pattern in December 2013. |
| Graphic provided by: TC2000.com. |
| |
| The First Five Days registered a negative signal in 2014 so we will have to wait till the end of January for a more conclusive signal but at this point there is a roughly 50-50 probability that the year will end down. This is important because a number of stocks, including Facebook (FB) appear to be struggling with key resistance levels. On January 8 it generated a doji which is often bearish in an uptrend. The next day it registered a bearish engulfing candle as the stock lost 1.75%. Key resistance is at $58.60 and if this level proves to be unbreakable, the stock will form a double top. |
|
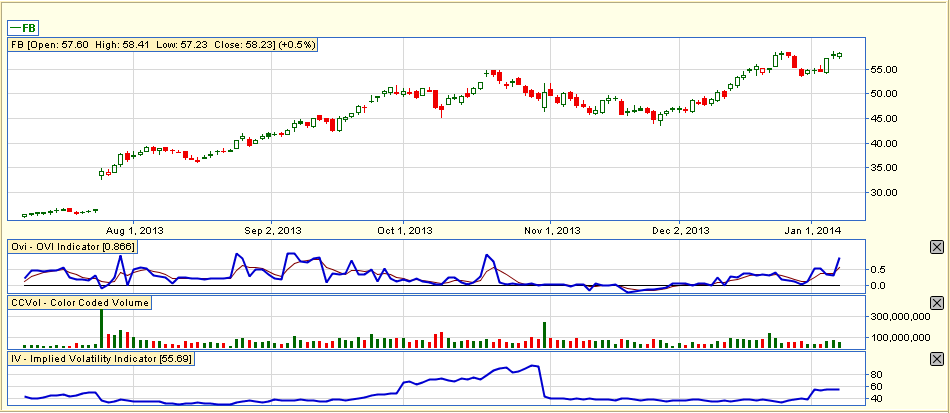
| Figure 2 � Daily chart of Facebook showing options activity with the OVI indicator (middle sub-graph) showing previous areas when the OVI was at current levels. The latest chart on January 9 is actually bullish as it shows options traders taking long positions. |
| Graphic provided by: http://www.oviindex.com. |
| |
| Figure 1 shows the bullish invalidation of the head & shoulders top pattern that formed in late 2013. As experienced traders have learned, when a pattern is invalidated, it can often be a powerful reversal signal. The chart also shows the potential double top chart pattern at key resistance. Note that the RSI was well into overbought territory and buying volume has been weak, both of which are bearish. Figure 2 provides an insight into what options traders have been doing in FB. The OVI indicator (middle sub-graph) shows that options traders are bullish and what has happened to the stock price in the past when option trading activity was at current levels. For a more detailed explanation of the OVI indicator developed by Guy Cohen, please see here. |
|
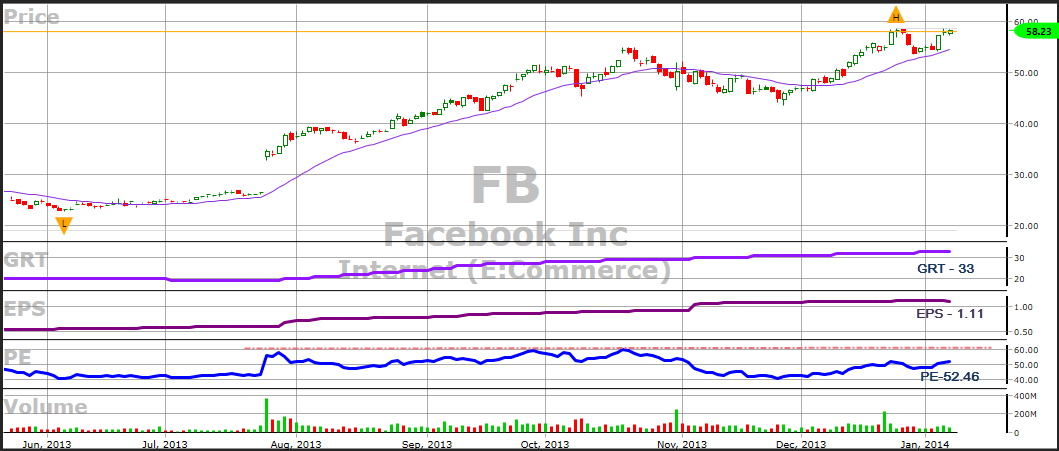
| Figure 3 � Daily chart of Facebook showing some key fundamentals in the lower sub-graphs. Although the forecasted growth rate (GRT) and Earning per Share (EPS) are still rising, each time the PE has approached 60, there has been a pullback. |
| Graphic provided by: http://www.VectorVest.com. |
| |
| Finally, what are some key fundamental indicators saying? As the next chart which plots price action together with fundamentals shows, the forecasted growth rate and forecasted earnings per share are expanding, which is positive but PE is close to 60 -- a level which has previously formed resistance in the stock price. It should be noted that generally fundamentals lag price action so the fact that earnings and growth rate are expanding are not necessarily indicative of higher stock prices going forward. In summary, although option traders are bullish, current resistance at $58.60 has the potential to be some sort of top in FB, especially if the market continues to weaken from here. The key caveat is that if it is decisively broken to the upside and the market powers higher, it could also provide a strong buy signal with resistance becoming support. |
Matt Blackman is a full-time technical and financial writer and trader. He produces corporate and financial newsletters, and assists clients in getting published in the mainstream media. He is the host of TradeSystemGuru.com. Matt has earned the Chartered Market Technician (CMT) designation. Find out what stocks and futures Matt is watching on Twitter at www.twitter.com/RatioTrade
| Company: | TradeSystemGuru.com |
| Address: | Box 2589 |
| Garibaldi Highlands, BC Canada | |
| Phone # for sales: | 604-898-9069 |
| Fax: | 604-898-9069 |
| Website: | www.tradesystemguru.com |
| E-mail address: | indextradermb@gmail.com |
Traders' Resource Links | |
| TradeSystemGuru.com has not added any product or service information to TRADERS' RESOURCE. | |
Click here for more information about our publications!
Comments

Request Information From Our Sponsors
- StockCharts.com, Inc.
- Candle Patterns
- Candlestick Charting Explained
- Intermarket Technical Analysis
- John Murphy on Chart Analysis
- John Murphy's Chart Pattern Recognition
- John Murphy's Market Message
- MurphyExplainsMarketAnalysis-Intermarket Analysis
- MurphyExplainsMarketAnalysis-Visual Analysis
- StockCharts.com
- Technical Analysis of the Financial Markets
- The Visual Investor
- VectorVest, Inc.
- Executive Premier Workshop
- One-Day Options Course
- OptionsPro
- Retirement Income Workshop
- Sure-Fire Trading Systems (VectorVest, Inc.)
- Trading as a Business Workshop
- VectorVest 7 EOD
- VectorVest 7 RealTime/IntraDay
- VectorVest AutoTester
- VectorVest Educational Services
- VectorVest OnLine
- VectorVest Options Analyzer
- VectorVest ProGraphics v6.0
- VectorVest ProTrader 7
- VectorVest RealTime Derby Tool
- VectorVest Simulator
- VectorVest Variator
- VectorVest Watchdog