HOT TOPICS LIST
- MACD
- Fibonacci
- RSI
- Gann
- ADXR
- Stochastics
- Volume
- Triangles
- Futures
- Cycles
- Volatility
- ZIGZAG
- MESA
- Retracement
- Aroon
INDICATORS LIST
LIST OF TOPICS
PRINT THIS ARTICLE
by Koos van der Merwe
Yelp, Inc. is an American company that operates an "online urban guide" and business review site.
Position: Buy
Koos van der Merwe
Has been a technical analyst since 1969, and has worked as a futures and options trader with First Financial Futures in Johannesburg, South Africa.
PRINT THIS ARTICLE
ELLIOTT WAVE
Taking That Gamble
01/08/14 04:56:37 PMby Koos van der Merwe
Yelp, Inc. is an American company that operates an "online urban guide" and business review site.
Position: Buy
| If you own an iPad or cellphone that you download apps to, it is likely that one of the apps is Yelp. Yelp has more than 100 million monthly users and is worth more than $4 billion. Unlike other sites that specialize in user-generated content, Yelp's business depends entirely on allowing its users to write reviews, especially negative ones, of businesses. Yelp, Inc. (YELP) climbed to a record after JP Morgan Chase & Co. (JPM) boosted its 12-month target share price for the company by 19 percent. The report came two days after Telsey Advisory Group raised its stock price prediction on Yelp to $95 from $62 on advertising growth. The big question: "Are JP Morgan and Telsey too late in their upgrade, or does YELP shares have more upside?" Let's see what the technicals say. |

|
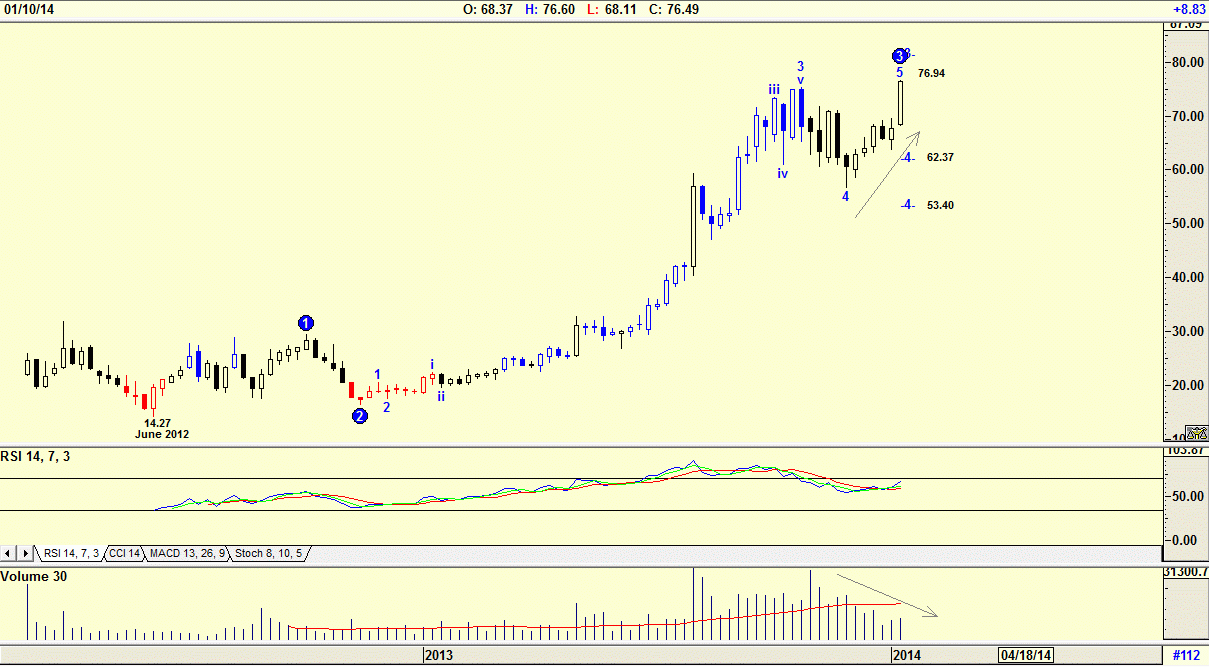
| Figure 1. Weekly Chart of YELP. |
| Graphic provided by: AdvancedGET. |
| |
| The chart in Figure 1 is a weekly chart showing how the share price has risen from a low of $14.27 in June 2012 to its present high of $76.94. The Elliott Wave count suggests that a WAVE 3 top with a Wave 4 correction is expected to either $62.37 or $53.40. This is confirmed by the RSI indicator which is falling. Note how volume has fallen as the share price rose, another sign of weakness ahead. |

|
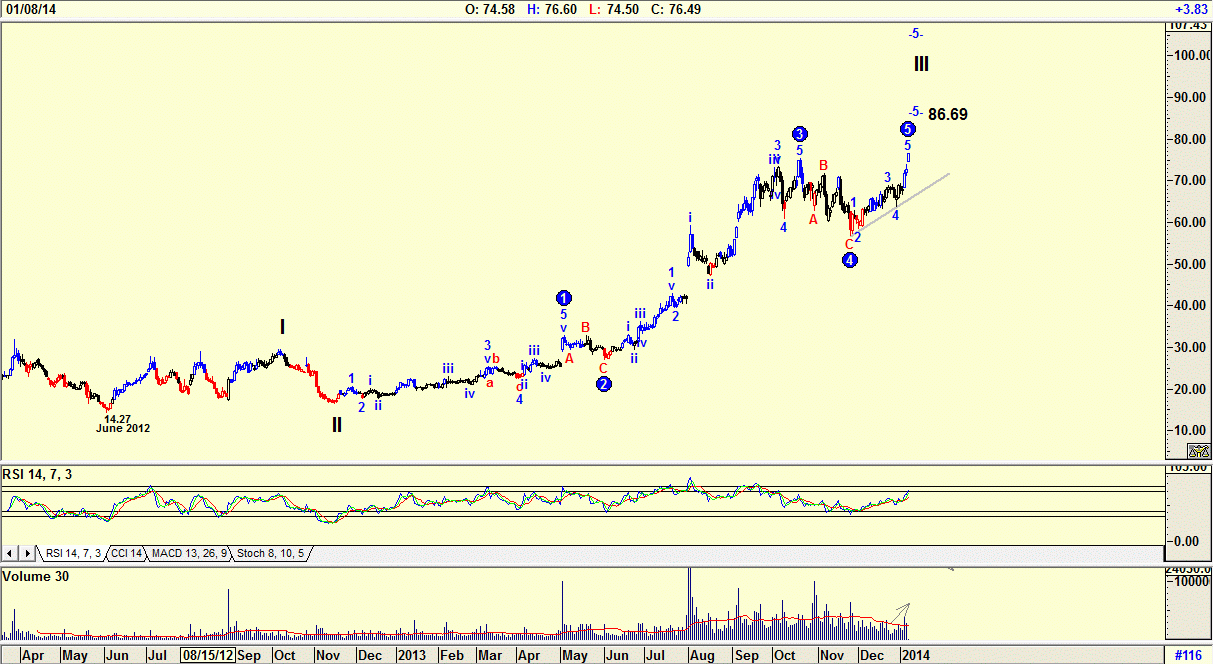
| Figure 2. Daily Chart of YELP. |
| Graphic provided by: AdvancedGET. |
| |
| The chart in Figure 2 is a daily chart with an Elliott Wave count suggesting that a WAVE 5 of WAVE III is forming with a possible high of $86.69. The RSI indicator is touching overbought levels, suggesting that a sell signal could be given in the near future. Note that on the daily chart, volume is rising as the price rises, suggesting strength. |

|
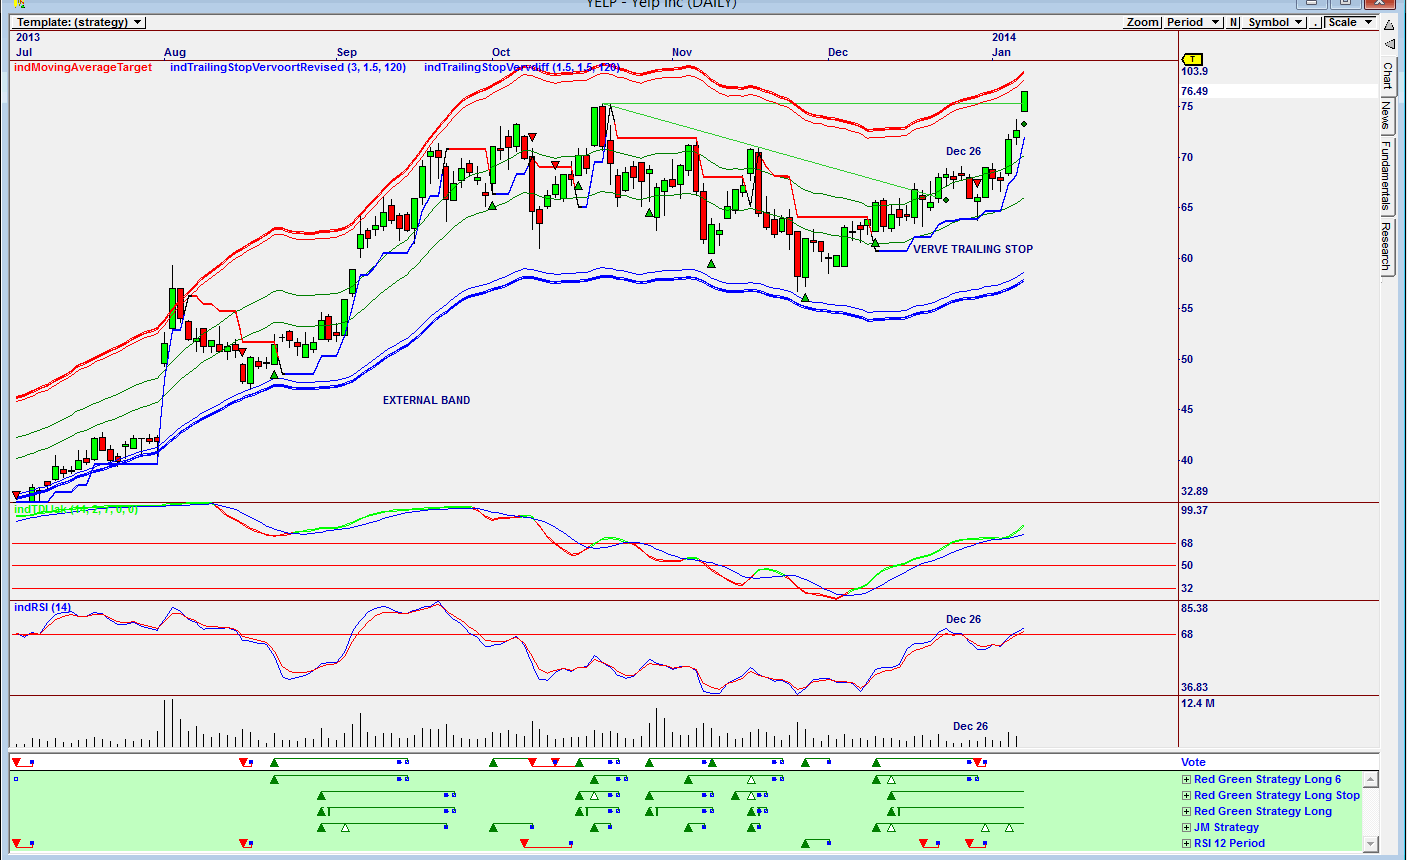
| Figure 3. Daily Omnitrader chart of YELP. |
| Graphic provided by: Omnitrader. |
| |
| The chart in Figure 3 is an Omnitrader chart, which suggests that there is still some upside left, as the price approaches the upper external band. Do note that a sell signal was given on the VOTE line on December 26, 2013 when the share price was $66.01. This was triggered by the RSI indicator, but the TDI indicator did not confirm the sell signal. Also note that the Red Green strategy Long Stop and the Red Green Strategy Long as well as the JM Strategy shown in green below the VOTE line, are still bullish. I would be a buyer of YELP at the present price. The charts are showing that there is still upside to the share price. However, because it is in an Elliott Wave 5 and the RSI indicator is at overbought levels, I would keep my trailing stop tight. Of course, there is the mantra one should follow, "leave the last 10% to the gambler," but with two major investors giving positive reports, taking that gamble could be profitable. |
Has been a technical analyst since 1969, and has worked as a futures and options trader with First Financial Futures in Johannesburg, South Africa.
| Address: | 3256 West 24th Ave |
| Vancouver, BC | |
| Phone # for sales: | 6042634214 |
| E-mail address: | petroosp@gmail.com |
Click here for more information about our publications!
Comments

Request Information From Our Sponsors
- VectorVest, Inc.
- Executive Premier Workshop
- One-Day Options Course
- OptionsPro
- Retirement Income Workshop
- Sure-Fire Trading Systems (VectorVest, Inc.)
- Trading as a Business Workshop
- VectorVest 7 EOD
- VectorVest 7 RealTime/IntraDay
- VectorVest AutoTester
- VectorVest Educational Services
- VectorVest OnLine
- VectorVest Options Analyzer
- VectorVest ProGraphics v6.0
- VectorVest ProTrader 7
- VectorVest RealTime Derby Tool
- VectorVest Simulator
- VectorVest Variator
- VectorVest Watchdog
- StockCharts.com, Inc.
- Candle Patterns
- Candlestick Charting Explained
- Intermarket Technical Analysis
- John Murphy on Chart Analysis
- John Murphy's Chart Pattern Recognition
- John Murphy's Market Message
- MurphyExplainsMarketAnalysis-Intermarket Analysis
- MurphyExplainsMarketAnalysis-Visual Analysis
- StockCharts.com
- Technical Analysis of the Financial Markets
- The Visual Investor
