

HOT TOPICS LIST
- MACD
- Fibonacci
- RSI
- Gann
- ADXR
- Stochastics
- Volume
- Triangles
- Futures
- Cycles
- Volatility
- ZIGZAG
- MESA
- Retracement
- Aroon
INDICATORS LIST
LIST OF TOPICS
PRINT THIS ARTICLE
by Donald W. Pendergast, Jr.
Learning to scan for stocks that are trending in the same direction on adjacent time frames can help make your trading workflow more productive.
Position: N/A
Donald W. Pendergast, Jr.
Freelance financial markets writer and online publisher of the Trendzetterz.com S&P 500 Weekly Forecast service.
PRINT THIS ARTICLE
TREND-CHANNEL
Baker Hughes: Waiting For Intraday Pullback
01/09/14 03:30:25 PMby Donald W. Pendergast, Jr.
Learning to scan for stocks that are trending in the same direction on adjacent time frames can help make your trading workflow more productive.
Position: N/A
| If you're a swing or position trader, you may already be aware that one of the keys to long-term success is to trade in the direction of the predominant trend that is driving a given stock higher or lower. The trick is to find a quick and effective way to locate such stocks so you can either: A. Put the stock on your watch list of trading candidates. B. Take immediate action if the trade setup is ready to move. Here's a look at one particularly useful way to uncover stocks that may be ready to setup for meaningful, multiday swing moves. |
|
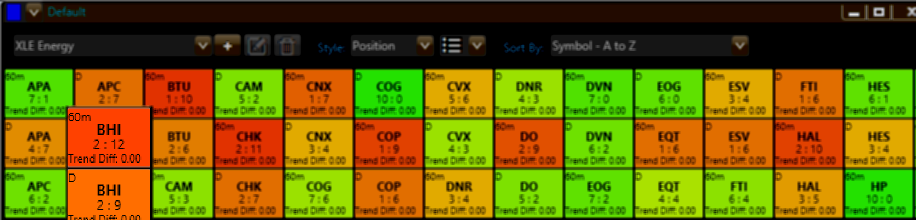
| Figure 1. The Trend Monitor enables fast visual scanning of the trend status of component stocks in four different sectors. |
| Graphic provided by: Phantom Trader by KnowVera Research LLC. |
| |
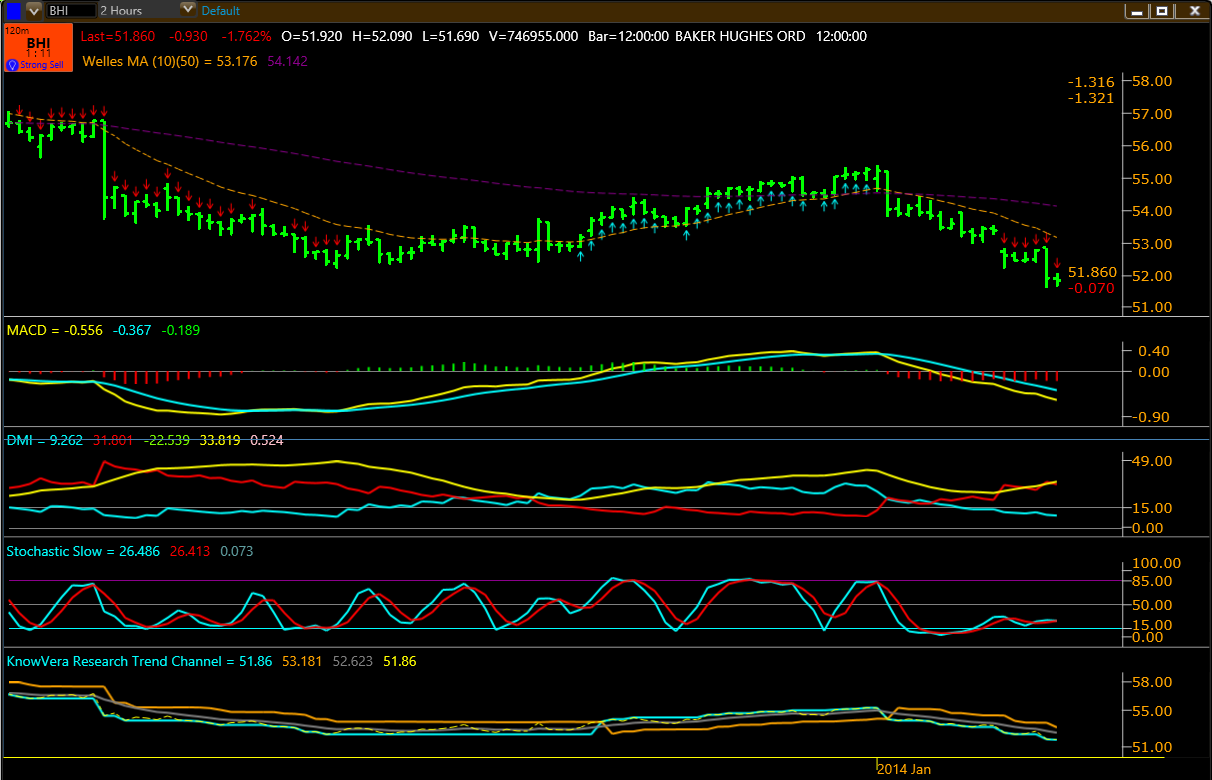
| Opening up the Trend Monitor in the Phantom Trader platform (Figure 1) reveals a number of ways to sort for stocks, exchange traded funds (ETFs), currencies, and commodities of interest; a great place to start — especially if you are an equity swing/position trader — is to visually scan through the pre-configured market sector screens: XLE Financials XLE Energy XLV Healthcare XLU Utilities Selecting the XLE Energy tab (in this case, using the "Position" trading time frame) brings up all the key component stocks within XLE (an exchange-traded fund); what you want to look for is the following: 1. To see if there is a sector-wide trend bias across the components (that is, a majority of green cells for a bullish sector trend or a majority of red cells for a bearish sector trend). 2. To see if a given component stock is bullish/bearish on at least two adjacent time frames. As of Wednesday at midday, there is an even balance of bullish, bearish and neutral component stocks within XLE; however, some issues are "double green" with a bullish trend score, while others are "double red" with weak, bearish scores. Baker Hughes (BHI) is one of the weak stocks; I had already done some homework on the stock and discovered that its earnings growth prospects are mixed and that it was also under performing the S&P 500 index (.SPX). Seeing that BHI has a trend score of 2:12 on its 60-minute time frame and a score of 2:9 on its daily time frame clearly indicated, I clicked on the 60-minute cell and the hourly chart of BHI appeared. I reset the time frame to two hours and also brought up the daily chart so as to keep a 3:1 ratio between the time frames. The daily chart (not shown) has just seen its trend channel go into bearish mode (orange on top, blue on bottom) even as its two-hour (120-minute) reveals a powerful downtrend in motion (Figure 2), one that features a rising ADX, bearish DMI, negative MACD, and bearish trend channel confirmation. While a trend should always be given the benefit of the doubt, it would be wise to wait for a lower-risk pullback entry on the chart (120-minutes) to help avoid the risk of a whipsaw or premature stopout. |
|
| Figure 2. BHI (Baker Hughes) experiences a powerful downtrend on its 120-minute time frame. The next key support area is near 50.60. |
| Graphic provided by: Phantom Trader by KnowVera Research LLC. |
| |
| Here's a simple way to track this setup, in hopes of snagging a great low-risk short entry price: 1. Watch to see if BHI moves up at least 2/3 of the way between its two-hour low of 51.67 and its 10-bar moving average at 52.96. 2. If the stochastic rises and begins to roll over again on such a pullback — and with the two-hour MACD still trending lower — you probably have identified a good place to put on about half of your short position. 3. If BHI continues to drop for one more bar after the pullback ends, consider putting on the second half of your short. 4. Use the 120-minute trend channel (lower part of chart) to help with trade management; make sure you take profits when the next key support area is reached; that's near 50.50 to 50.60, FYI. Since you're trading with the trend here, you may want to trade a slightly larger size than with a reversal-type trade. Always remember to check for impending earnings reports before putting on a short in a stock and to keep your risk lower on swing trades compared to the trade risk you can take on with longer-term positions. Trade wisely until we meet here again. |
Freelance financial markets writer and online publisher of the Trendzetterz.com S&P 500 Weekly Forecast service.
| Title: | Market consultant and writer |
| Company: | Trendzetterz |
| Address: | 81 Hickory Hollow Drive |
| Crossville, TN 38555 | |
| Phone # for sales: | 904-303-4814 |
| Website: | trendzetterz.com |
| E-mail address: | support@trendzetterz.com |
Traders' Resource Links | |
| Trendzetterz has not added any product or service information to TRADERS' RESOURCE. | |
Click here for more information about our publications!
Comments

Request Information From Our Sponsors
- StockCharts.com, Inc.
- Candle Patterns
- Candlestick Charting Explained
- Intermarket Technical Analysis
- John Murphy on Chart Analysis
- John Murphy's Chart Pattern Recognition
- John Murphy's Market Message
- MurphyExplainsMarketAnalysis-Intermarket Analysis
- MurphyExplainsMarketAnalysis-Visual Analysis
- StockCharts.com
- Technical Analysis of the Financial Markets
- The Visual Investor
- VectorVest, Inc.
- Executive Premier Workshop
- One-Day Options Course
- OptionsPro
- Retirement Income Workshop
- Sure-Fire Trading Systems (VectorVest, Inc.)
- Trading as a Business Workshop
- VectorVest 7 EOD
- VectorVest 7 RealTime/IntraDay
- VectorVest AutoTester
- VectorVest Educational Services
- VectorVest OnLine
- VectorVest Options Analyzer
- VectorVest ProGraphics v6.0
- VectorVest ProTrader 7
- VectorVest RealTime Derby Tool
- VectorVest Simulator
- VectorVest Variator
- VectorVest Watchdog