

HOT TOPICS LIST
- MACD
- Fibonacci
- RSI
- Gann
- ADXR
- Stochastics
- Volume
- Triangles
- Futures
- Cycles
- Volatility
- ZIGZAG
- MESA
- Retracement
- Aroon
INDICATORS LIST
LIST OF TOPICS
PRINT THIS ARTICLE
by Donald W. Pendergast, Jr.
After having enjoyed such a massive rally, can Micron Technology manage a new rally in the new year?
Position: N/A
Donald W. Pendergast, Jr.
Freelance financial markets writer and online publisher of the Trendzetterz.com S&P 500 Weekly Forecast service.
PRINT THIS ARTICLE
SUPPORT & RESISTANCE
Micron Technology: Pullback or Correction?
01/08/14 04:52:40 PMby Donald W. Pendergast, Jr.
After having enjoyed such a massive rally, can Micron Technology manage a new rally in the new year?
Position: N/A
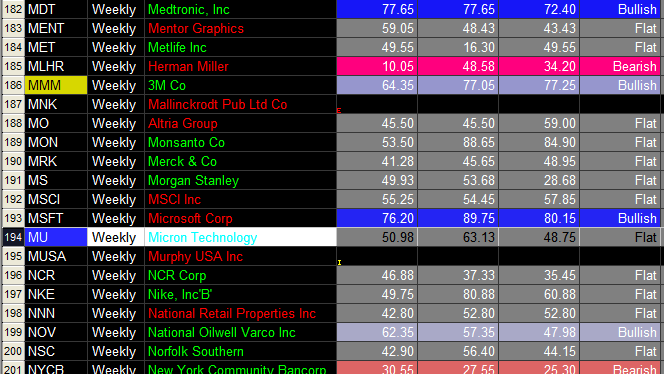
| With weakening fundamentals and a pullback from a multi-year high underway, traders and investors will be watching with interest as Micron Technology releases its Q4 2013 earnings on January 7, 2014. MU has closed beneath its eight-week simple moving average for the first time since October 2013 and is also exhibiting some signs that the "smart money" may be preparing to drive the stock even lower as January 2014 unfolds. Here's a closer look. |
|
| Figure 1. Micron Technology's fundamental score has slipped to 50.98, down from the prior quarter's reading of 63.13. |
| Graphic provided by: TradeStation. |
| Graphic provided by: TradeStation Fundamental Score Indicator. |
| |
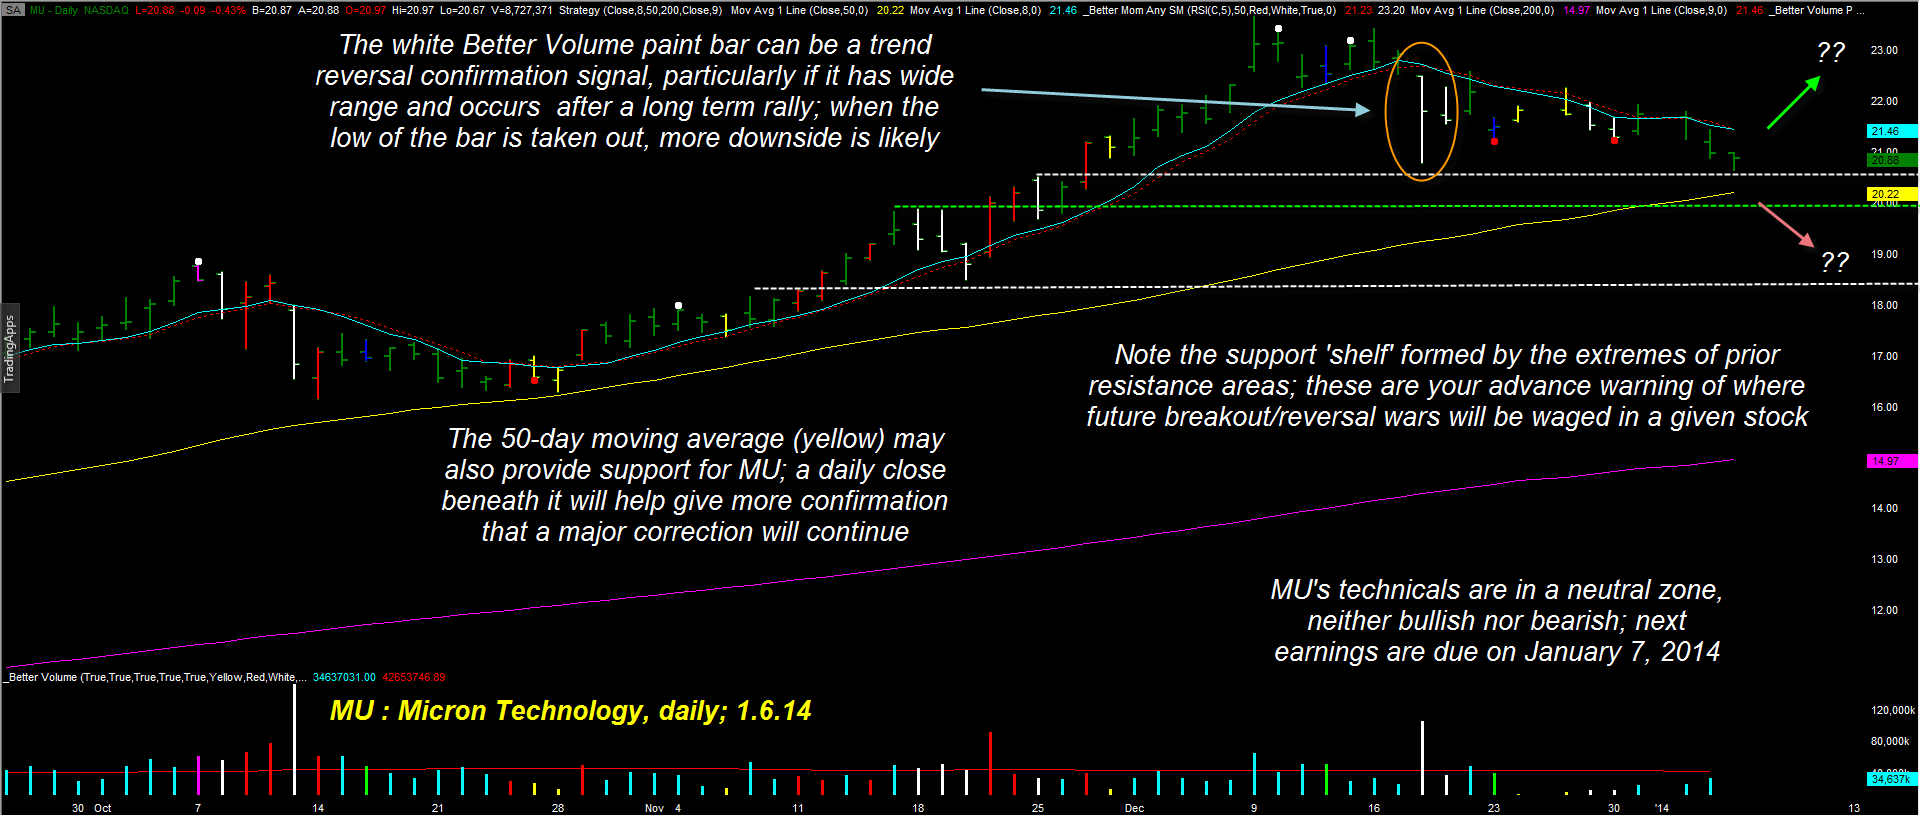
| When attempting to size up a high-probability swing trade, some key questions need to be answered, and once you have the answers it becomes easier to determine the probabilities of success/failure for a given trade: 1. What is the dominant trend (the trend that is three to five degrees higher than the intended trading time frame) of the stock? 2. Where are the key support/resistance price zones for the stock? 3. Is the "smart money" buying, selling or simply holding? 4. Are there significant chart patterns that are warning of a potential breakdown or reversal? 5. Are the fundamental measures (ROE, debt to equity, earnings growth rates, etc.) bullish, neutral or bearish? 5. Is the stock outperforming/underperforming the broad market indexes on a given time frame? While it's rare to find a "perfect" trading candidate that would see all of the above technical/fundamental criteria confirm a given trade entry, using such tools can help provide an edge when scanning for swing or position trading setups in liquid stocks. In the case of MU, we find the following dynamics in play: 1. The stock is still in the bull rally that began in 2003 but is actually in a long-term bear market that began with the tech collapse in 2000. 2. Its price run-up since late 2012 was good for a 300%-plus rally, one that had gotten a bit parabolic once it peaked out in mid-December 2013. 3. The 21- and 34-week Chaikin Money flow histograms (CMF) both confirm that distribution has been underway since the late summer of 2013 (smart money lightening up on their holdings). 3. The fundamental score (of eight weighted fundamental measures) has deteriorated over the past quarter, with the stock now dropping to a "flat" rating from a "bullish" rating. 4. After hitting a key standard deviation resistance on December 9, 2013, the stock began to correct, and then on December 18, 2013, a white wide range Better Volume paint bar printed on MU's daily chart (Figure 2). A white Better Volume paint bar (available from emini-watch.com and you must also have Trade Station to plot them) that appears after a 300%, 15-month rally can be a warning of a major correction and/or bearish trend reversal; a drop beneath the low of the bar can sometimes see a great deal of new selling pressure. |
|
| Figure 2. When a wide-range, white Better Volume paint bar appears after a momentous uptrend has hit key resistance, it can mean that a stock is setting up for a notable correction. |
| Graphic provided by: TradeStation. |
| Graphic provided by: Better Volume indicators from Emini-Watch.com. |
| |
| Prices dipped below 20.81 (the low of the white Better Volume bar) on January 6, 2014, but it's the reaction of traders to MU's earnings on January 7, 2014 that will help determine the bear term direction for MU. On the chart are three critical support/resistance lines (S/R) that should act as potential reversal zones within the next few weeks; favorable earnings may see a new rally attempt from the upper line near 20.50. Negative earnings could easily propel MU down toward the second line near 20.00; if that line is broken on a daily/weekly closing basis, look for the bottom support line near 18.50 to provide extremely strong support for a tradable bullish swing move. As with virtually all stocks, earnings are a prime catalyst for stock movement. Long-term, the stock needs a breather to draw in a fresh round of new big-money buyers; short-term, a tradable swing move could appear soon if the quarterly earnings are favorable. Do your own research and be ready for whatever this highly volatile, never boring stock may send your way. Trade wisely until we meet here again. |
Freelance financial markets writer and online publisher of the Trendzetterz.com S&P 500 Weekly Forecast service.
| Title: | Market consultant and writer |
| Company: | Trendzetterz |
| Address: | 81 Hickory Hollow Drive |
| Crossville, TN 38555 | |
| Phone # for sales: | 904-303-4814 |
| Website: | trendzetterz.com |
| E-mail address: | support@trendzetterz.com |
Traders' Resource Links | |
| Trendzetterz has not added any product or service information to TRADERS' RESOURCE. | |
Click here for more information about our publications!
PRINT THIS ARTICLE

Request Information From Our Sponsors
- StockCharts.com, Inc.
- Candle Patterns
- Candlestick Charting Explained
- Intermarket Technical Analysis
- John Murphy on Chart Analysis
- John Murphy's Chart Pattern Recognition
- John Murphy's Market Message
- MurphyExplainsMarketAnalysis-Intermarket Analysis
- MurphyExplainsMarketAnalysis-Visual Analysis
- StockCharts.com
- Technical Analysis of the Financial Markets
- The Visual Investor
- VectorVest, Inc.
- Executive Premier Workshop
- One-Day Options Course
- OptionsPro
- Retirement Income Workshop
- Sure-Fire Trading Systems (VectorVest, Inc.)
- Trading as a Business Workshop
- VectorVest 7 EOD
- VectorVest 7 RealTime/IntraDay
- VectorVest AutoTester
- VectorVest Educational Services
- VectorVest OnLine
- VectorVest Options Analyzer
- VectorVest ProGraphics v6.0
- VectorVest ProTrader 7
- VectorVest RealTime Derby Tool
- VectorVest Simulator
- VectorVest Variator
- VectorVest Watchdog