

HOT TOPICS LIST
- MACD
- Fibonacci
- RSI
- Gann
- ADXR
- Stochastics
- Volume
- Triangles
- Futures
- Cycles
- Volatility
- ZIGZAG
- MESA
- Retracement
- Aroon
INDICATORS LIST
LIST OF TOPICS
PRINT THIS ARTICLE
by David Penn
Starting October with a rally, the S&P 500's next move may be on the other end of a diamond.
Position: N/A
David Penn
Technical Writer for Technical Analysis of STOCKS & COMMODITIES magazine, Working-Money.com, and Traders.com Advantage.
PRINT THIS ARTICLE
THE DIAMOND
S&P 500: Diamond Up or Down?
10/03/02 11:55:38 AMby David Penn
Starting October with a rally, the S&P 500's next move may be on the other end of a diamond.
Position: N/A
| For someone who views week to week changes of four percent or more as strong indication of price momentum, the recent, one-day 4% surge upward in the S&P 500 was an attention-grabber. It was also an excellent example of how important context can be. |
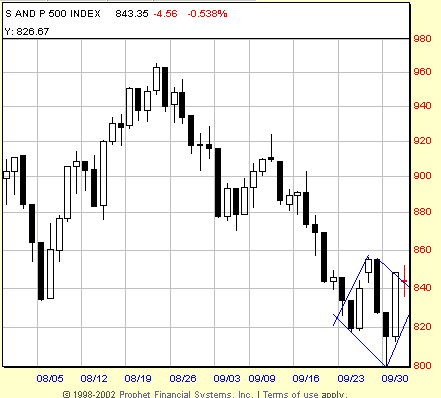
| The up-day of October 2, 2002 appears to trace out the second half of a diamond formation. The diamond formation can be both a continuation as well as a reversal pattern, and is formed by two sets of parallel trendlines--as shown in the chart of the S&P 500 presented here. Because prices can break from a diamond in either direction, it is usually advised to wait for prices to penetrate beyond one of the right-side trendlines before taking a position--long or short. |
|
| Figure 1: A diamond pattern emerges at the end of this downtrend in the S&P 500. |
| Graphic provided by: Prophet.net. |
| |
| The size of the formation tends to determine the length of the breakout's initial move. The six-day diamond forming in the S&P 500 has a high of 860 and an intraday low of 800, providing for a formation size of 60 points. Adding this amount to an upside breakout point of about 840 gives an upside target of 900--setting up a test of the September highs (such as they were). A downside breakout point of 820, on the other hand, would suggest a downside target of 760, which would likely represent a test of the July lows. |
| There is an important caveat about diamonds. Diamond patterns are as prone to false breakouts as any number of other chart patterns. A look at the December Japanese yen futures contract is instructive in this regard. The December yen was breaking down from a triangle top (see my "Forex Triangle Tops," Traders.com Advantage, 9/10/02) when it began a sharp, flag-like counter move to the upside. After gapping down sharply against this trend (resuming the downtrend from the triangle top), December yen began moving up again. |
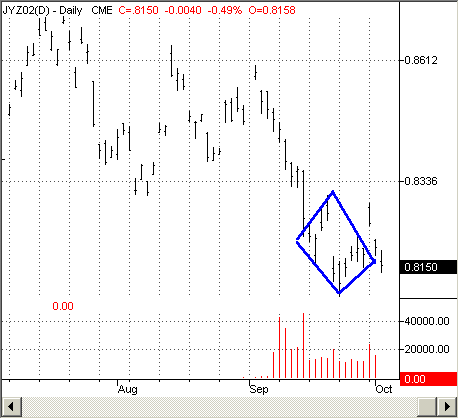 Figure 2: This diamond in December Japanese yen futures initially broke to the upside. Graphic provided by TradeStation This movement appears to have traced out a diamond pattern. December yen initially gapped up and out of the pattern in late September. But more recently, December yen has been moving back down. This combination of events suggests a false break to the upside, with a resumption of the down trend following shortly thereafter. Thus, one rule of thumb with diamonds--that the top and bottom of the formation tend to represent resistance and support, respectively, can be helpful in assessing the necessary follow-through any breakout requires in order to become a trend. |
Technical Writer for Technical Analysis of STOCKS & COMMODITIES magazine, Working-Money.com, and Traders.com Advantage.
| Title: | Technical Writer |
| Company: | Technical Analysis, Inc. |
| Address: | 4757 California Avenue SW |
| Seattle, WA 98116 | |
| Phone # for sales: | 206 938 0570 |
| Fax: | 206 938 1307 |
| Website: | www.Traders.com |
| E-mail address: | DPenn@traders.com |
Traders' Resource Links | |
| Charting the Stock Market: The Wyckoff Method -- Books | |
| Working-Money.com -- Online Trading Services | |
| Traders.com Advantage -- Online Trading Services | |
| Technical Analysis of Stocks & Commodities -- Publications and Newsletters | |
| Working Money, at Working-Money.com -- Publications and Newsletters | |
| Traders.com Advantage -- Publications and Newsletters | |
| Professional Traders Starter Kit -- Software | |
Click here for more information about our publications!
Comments
Date:�10/08/02Rank:�5Comment:�

Request Information From Our Sponsors
- StockCharts.com, Inc.
- Candle Patterns
- Candlestick Charting Explained
- Intermarket Technical Analysis
- John Murphy on Chart Analysis
- John Murphy's Chart Pattern Recognition
- John Murphy's Market Message
- MurphyExplainsMarketAnalysis-Intermarket Analysis
- MurphyExplainsMarketAnalysis-Visual Analysis
- StockCharts.com
- Technical Analysis of the Financial Markets
- The Visual Investor
- VectorVest, Inc.
- Executive Premier Workshop
- One-Day Options Course
- OptionsPro
- Retirement Income Workshop
- Sure-Fire Trading Systems (VectorVest, Inc.)
- Trading as a Business Workshop
- VectorVest 7 EOD
- VectorVest 7 RealTime/IntraDay
- VectorVest AutoTester
- VectorVest Educational Services
- VectorVest OnLine
- VectorVest Options Analyzer
- VectorVest ProGraphics v6.0
- VectorVest ProTrader 7
- VectorVest RealTime Derby Tool
- VectorVest Simulator
- VectorVest Variator
- VectorVest Watchdog