HOT TOPICS LIST
- MACD
- Fibonacci
- RSI
- Gann
- ADXR
- Stochastics
- Volume
- Triangles
- Futures
- Cycles
- Volatility
- ZIGZAG
- MESA
- Retracement
- Aroon
INDICATORS LIST
LIST OF TOPICS
PRINT THIS ARTICLE
by Koos van der Merwe
With the property market recovering, is it time to look at real estate investment trusts?
Position: Accumulate
Koos van der Merwe
Has been a technical analyst since 1969, and has worked as a futures and options trader with First Financial Futures in Johannesburg, South Africa.
PRINT THIS ARTICLE
ELLIOTT WAVE
EastGroup Properties
01/07/14 05:31:32 PMby Koos van der Merwe
With the property market recovering, is it time to look at real estate investment trusts?
Position: Accumulate
| We all know how the property market tumbled in 2007 as the mortgage backed security bubble burst, and with banks being held accountable for the fiasco — banks that we trusted, re-entering investments in the property market for many is a no-no. However, the US economy is recovering, and property prices are once again starting to rise. Does that mean it is time to start nibbling at property shares? When you read that Nouriel Roubini, aka "Dr. Doom", is getting optimistic about the market, isn't that the trigger you have been waiting for? One company that has caught my attention is EastGroup Properties Inc. The company is a self-administered equity real estate investment trust focused on the development, acquisition, and ownership of industrial properties throughout the United States. |

|
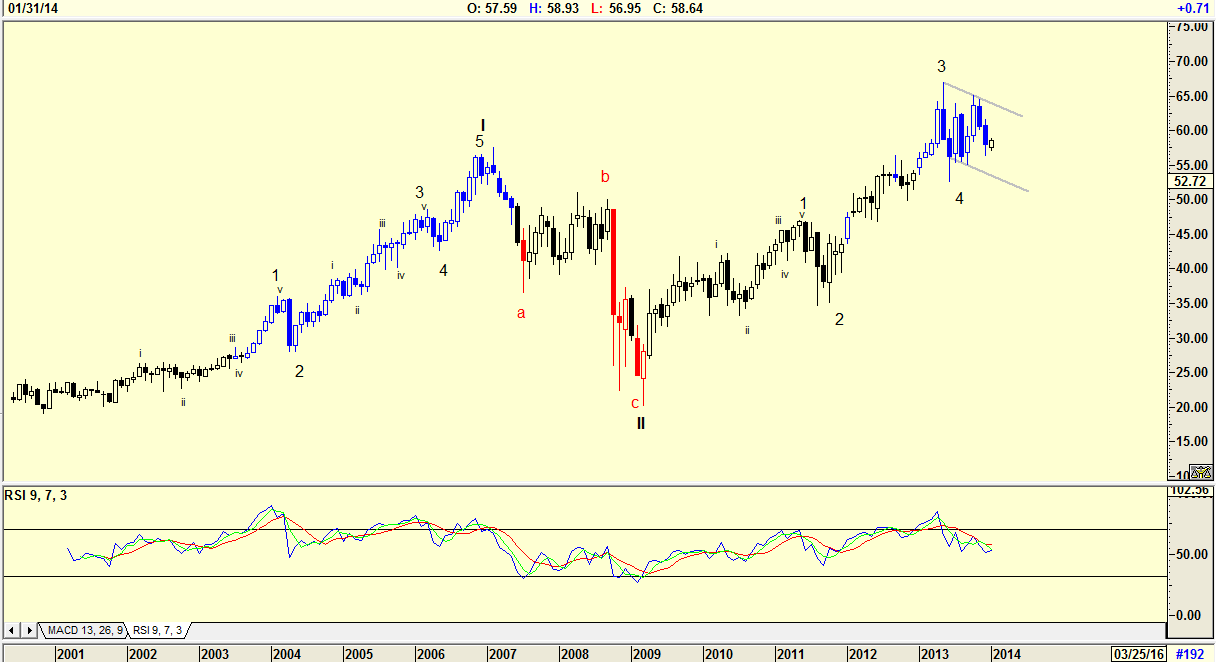
| Figure 1. Monthly chart with Elliot Wave count. |
| Graphic provided by: AdvancedGET. |
| |
| The chart in Figure 1 is a monthly chart suggesting that the share price is in a Wave 4 correction of a major WAVE III in a bull market. The RSI indicator is still showing weakness, suggesting that the price could fall further. |

|
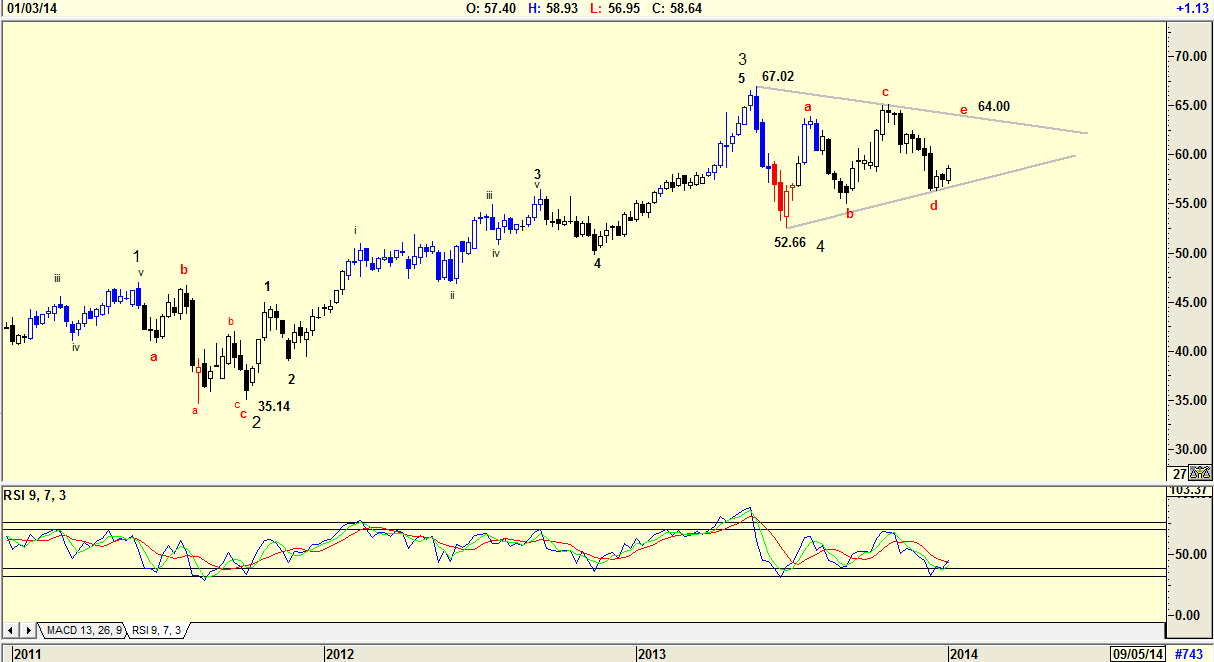
| Figure 2. Weekly chart suggesting a flag pattern. |
| Graphic provided by: AdvancedGET. |
| |
| The weekly chart in Figure 2 is suggesting a flag pattern is developing. If the pattern is correct, the wave count pattern of Wave 4 on the chart will change. The price will have to break above the upper trend line at point e in the region of $64.00. Should this occur, the target for Wave 5 will be $84.54. (67.02-35.13=31.88+52.66=84.54). The RSI indicator has given a buy signal. |

|
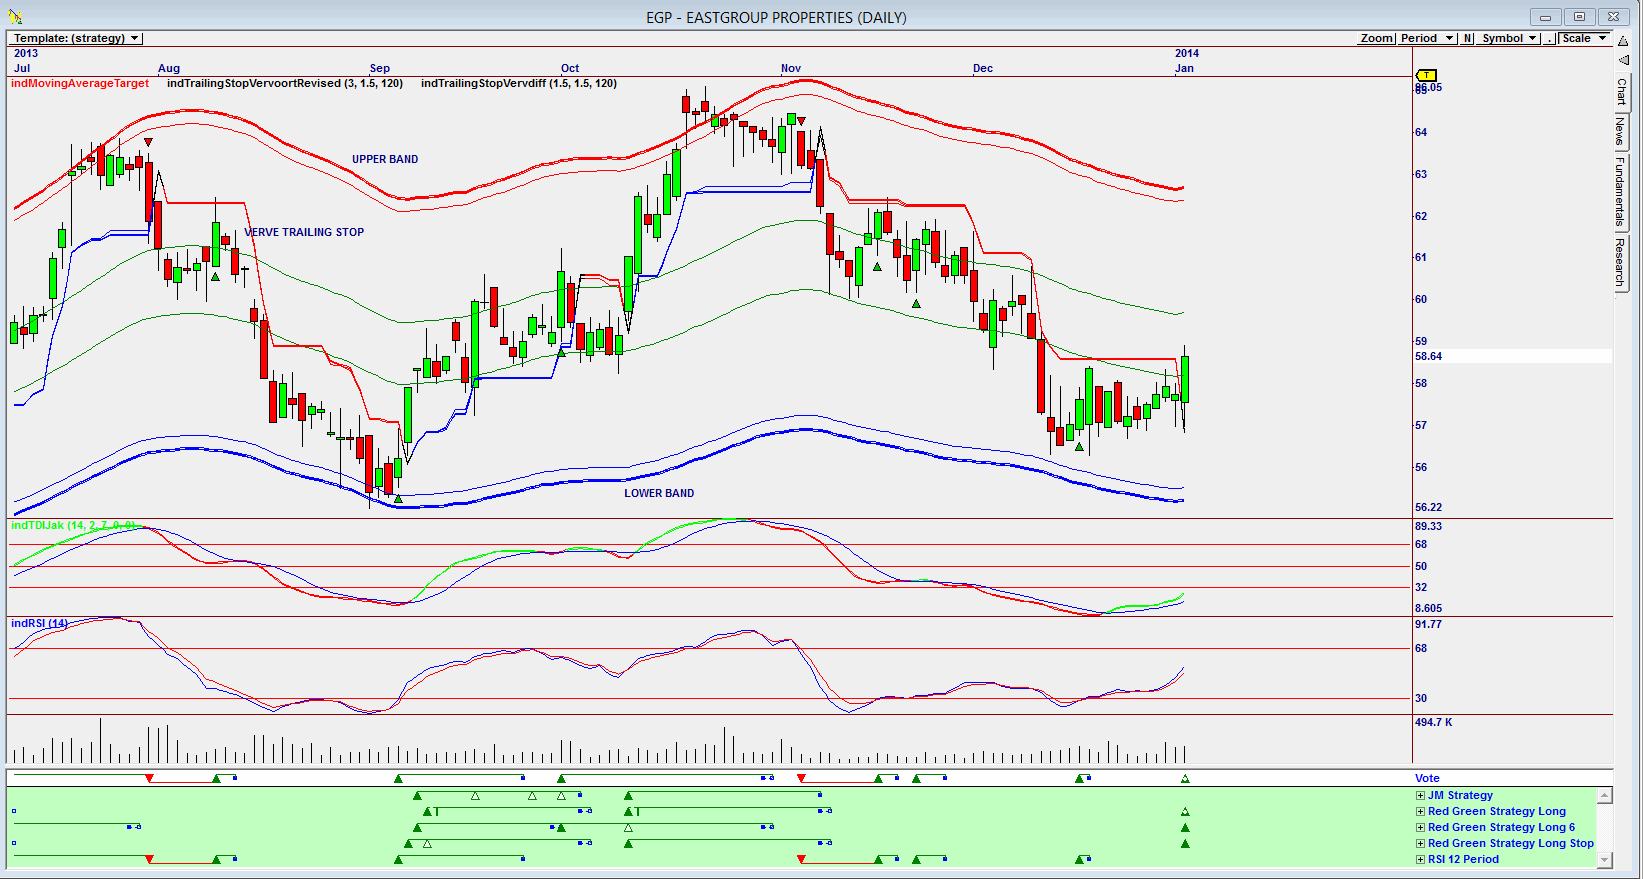
| Figure 3. Daily chart showing a Vote line buy signal. |
| Graphic provided by: Omnitrader. |
| |
| My final chart is an Omnitrader chart that brought the share to my attention. The chart is a daily chart showing how the share price fell from the upper external band as the two indicators, the TDIJak and the RSI(14), gave sell signals. Both indicators are presently in buy mode, and with the VOTE line signalling a buy based on the three strategies, Red Green Long, Red Green Long 6 and Red Green Long stop, the share looks interesting. Do note also that the share price has broken above the Verve trailing stop. |
Has been a technical analyst since 1969, and has worked as a futures and options trader with First Financial Futures in Johannesburg, South Africa.
| Address: | 3256 West 24th Ave |
| Vancouver, BC | |
| Phone # for sales: | 6042634214 |
| E-mail address: | petroosp@gmail.com |
Click here for more information about our publications!
PRINT THIS ARTICLE

Request Information From Our Sponsors
- StockCharts.com, Inc.
- Candle Patterns
- Candlestick Charting Explained
- Intermarket Technical Analysis
- John Murphy on Chart Analysis
- John Murphy's Chart Pattern Recognition
- John Murphy's Market Message
- MurphyExplainsMarketAnalysis-Intermarket Analysis
- MurphyExplainsMarketAnalysis-Visual Analysis
- StockCharts.com
- Technical Analysis of the Financial Markets
- The Visual Investor
- VectorVest, Inc.
- Executive Premier Workshop
- One-Day Options Course
- OptionsPro
- Retirement Income Workshop
- Sure-Fire Trading Systems (VectorVest, Inc.)
- Trading as a Business Workshop
- VectorVest 7 EOD
- VectorVest 7 RealTime/IntraDay
- VectorVest AutoTester
- VectorVest Educational Services
- VectorVest OnLine
- VectorVest Options Analyzer
- VectorVest ProGraphics v6.0
- VectorVest ProTrader 7
- VectorVest RealTime Derby Tool
- VectorVest Simulator
- VectorVest Variator
- VectorVest Watchdog
