

HOT TOPICS LIST
- MACD
- Fibonacci
- RSI
- Gann
- ADXR
- Stochastics
- Volume
- Triangles
- Futures
- Cycles
- Volatility
- ZIGZAG
- MESA
- Retracement
- Aroon
INDICATORS LIST
LIST OF TOPICS
PRINT THIS ARTICLE
by Donald W. Pendergast, Jr.
After setting a fresh five-year high during the last week of 2013, shares of Williams Companies are reversing lower.
Position: N/A
Donald W. Pendergast, Jr.
Freelance financial markets writer and online publisher of the Trendzetterz.com S&P 500 Weekly Forecast service.
PRINT THIS ARTICLE
MOVING AVERAGES
WMB: Weak On The Hourly Time Frame
01/07/14 05:23:50 PMby Donald W. Pendergast, Jr.
After setting a fresh five-year high during the last week of 2013, shares of Williams Companies are reversing lower.
Position: N/A
| Like many other large-cap stocks in the S&P 500 index (.SPX, SPY), shares of Williams Companies (WMB) have multiplied in value many times over since coming out of the super multicycle lows of March 2009. Since then, WMB has increased in value by nearly 300%, no small feat in an era of near-zero savings accounts rates. And just as the .SPX has continued to make new multiyear (and record highs, too), so has WMB; its recent high of 38.68 (set on the last trading day of 2013) was the highest weekly close in the stock since the first week of July 2008 (when crude oil peaked out at 145.00 per barrel) and certainly makes a good case for the stock's long-term uptrend to continue higher into 2014. However, there are numerous headwinds for WMB bulls to be aware of, such as: 1. A declining quarterly earnings trend. 2. Anticipated long-term bear markets in crude oil and natural gas pricing power. 3. The ever-increasing likelihood of global deflation over the next five to seven years; the US stock market is perhaps the most over-inflated bubble on the planet now, meaning that all stocks — including large cap energy players like WMB — should see significant corrections through the remainder of this decade. 4. Many Elliott and cycle studies also suggest that the US stock market is close to a major correction, perhaps the largest one seen since the market declines of late 2008-early 2009. |
|
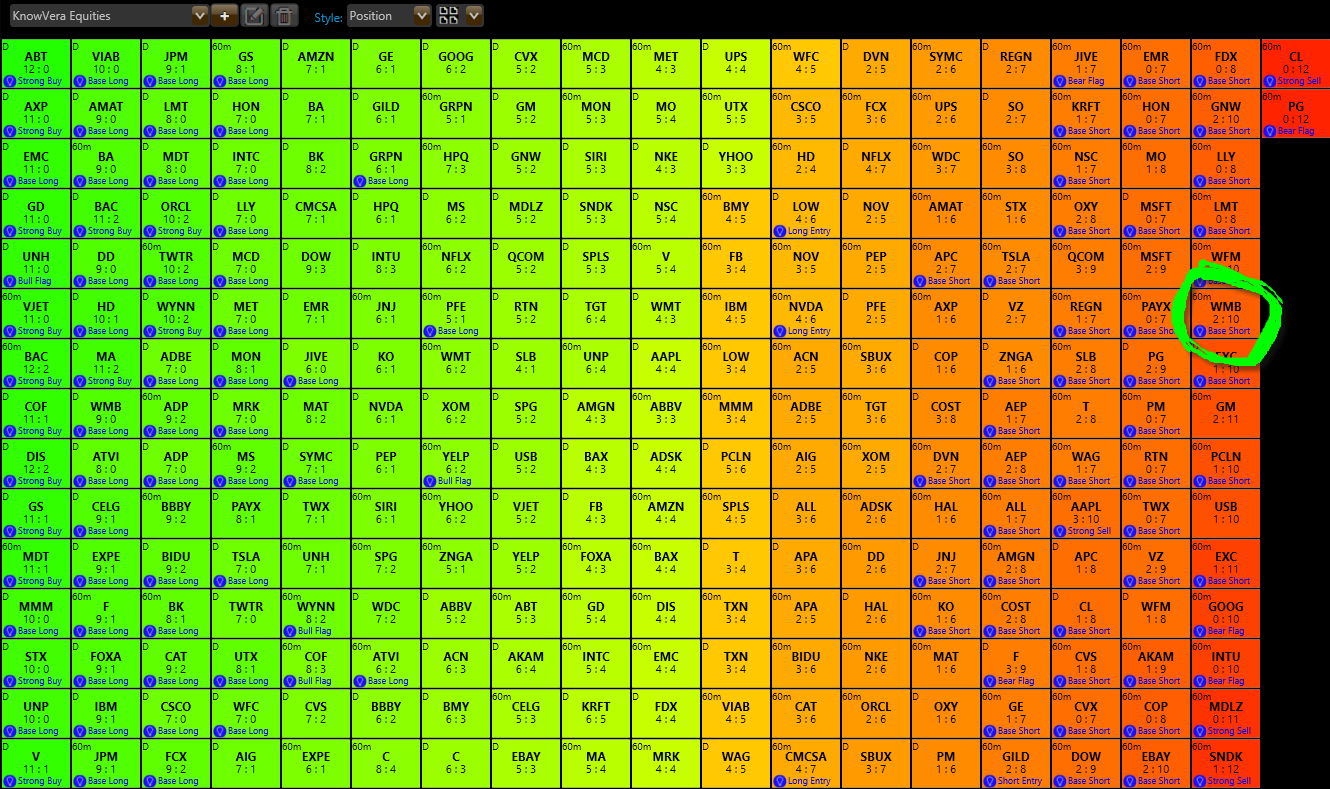
| Figure 1. The Trend Monitor identifies a possible short trading candidate on the 60-minute time frame. |
| Graphic provided by: Phantom Trader by KnowVera Research LLC. |
| |
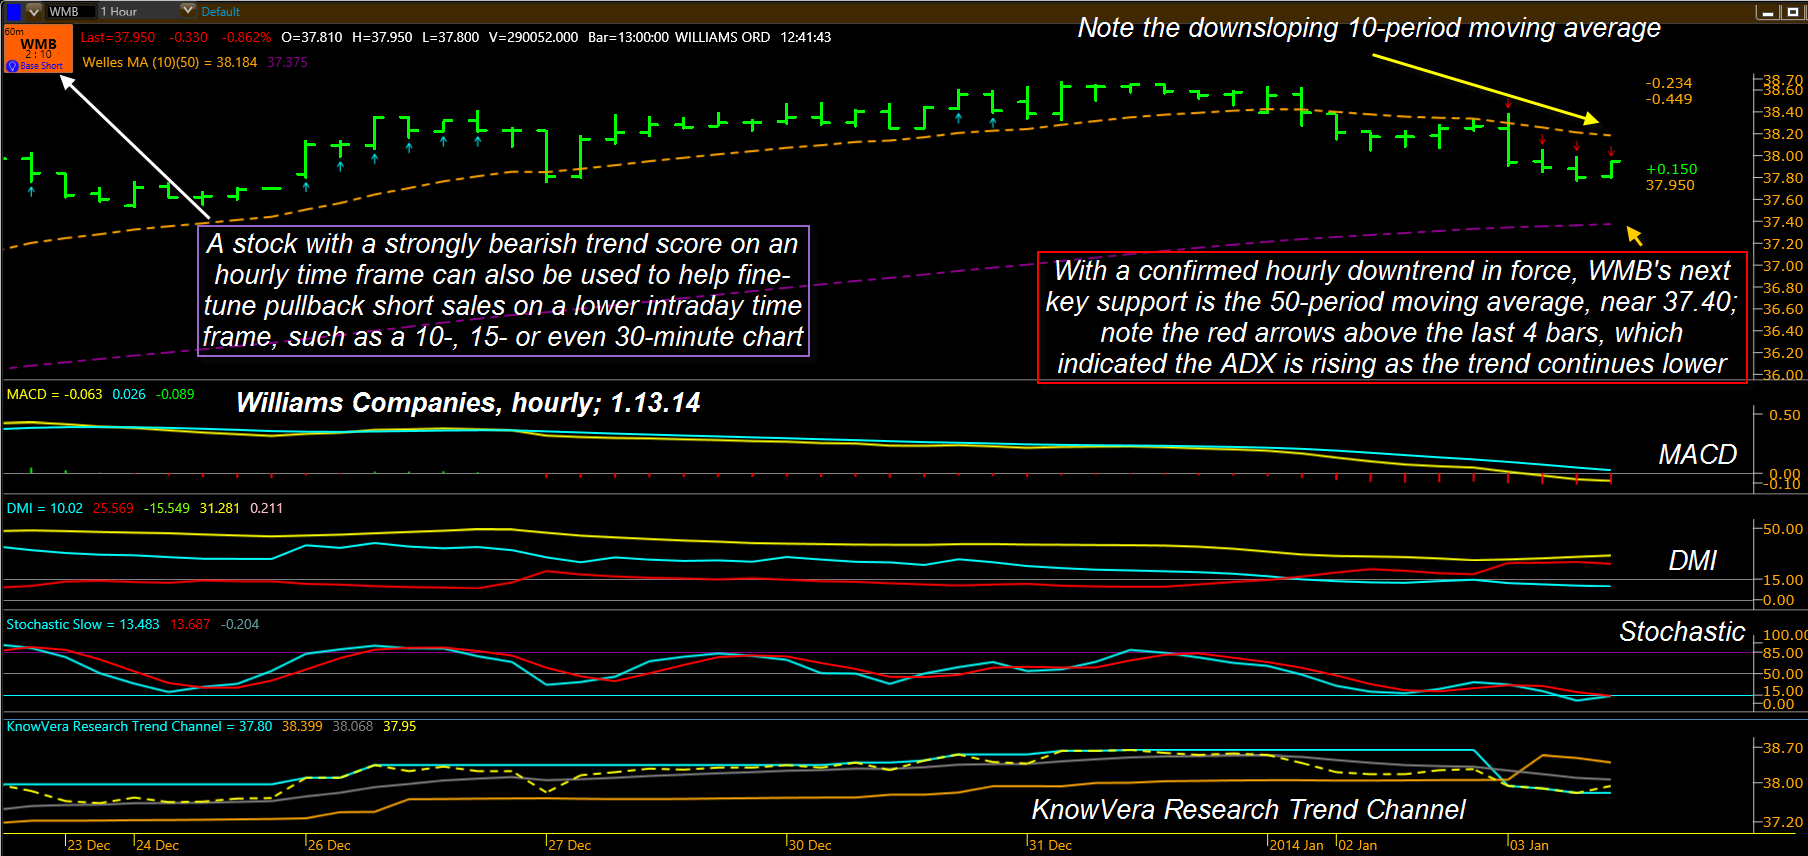
| At the moment though, all we really can base current trading decisions on is the charts in front of our eyes today; using the Trend Monitor (TM) within the Phantom Trader platform, it appears that WMB could be in the early stages of a corrective move, one that could have more downside available for swing traders (Figure 1). Notice the red cells in the TM, and for this stock; it says that WMB's 60-minute chart qualifies as a "base short" and has a trend score of 2:10. The maximum possible bearish score in the TM is 0:14, so a reading of 2:10 is still bearish enough to be worthy of a trader's attention. Clicking the cell for WMB brings up a 60-minute chart of WMB, and the technicals all agree that there is heavy downward pressure on the stock in this time frame (Figure 2). * MACD is negative (histogram below zero line) with a wide spread. * DMI is negative * ADX is rising (note the red arrows above the last few price bars) * The KnowVera Trend Channel has crossed into bearish mode (orange channel is above the blue channel). The 10-period moving average (dashed orange line) is also sloping downward and has already served as a powerful resistance barrier. Obviously, WMB is looking plenty bearish on its hourly chart — so now what? |
|
| Figure 2. Correction of the dominant trend or just a minor pullback within it? Careful evaluation of trend dynamics across multiple time frames can help answer this age-old question. |
| Graphic provided by: Phantom Trader by KnowVera Research LLC. |
| |
| Here are a couple of things to look for with WMB; first, if the stock continues down to test its hourly 50-period average, see if the 15-minute time frame is setting up for a bullish counter trend bounce — the 50-period average is always a great place to expect some sort of a tradable bounce after a steady decline on a given time frame. Secondly, WMB should begin to rally again, but before hitting support at the 50-period MA, see if the 10-period MA can contain such a rally. If it can't and WMB closes back above it, that might be a great place to start hunting for a new long entry spot. The big idea here is this: 1. Use appropriate screening/scanning tools to help you locate stocks of interest. 2. Be aware of the broad market dynamics that may affect such a stock. 3. Locate the key support/resistance and confirm the trend direction using a variety of dissimilar technical indicators. 4. Structure your trades so your entries always agree with the key support/resistance areas on your trading time frame. Trade wisely as we enter this new year! |
Freelance financial markets writer and online publisher of the Trendzetterz.com S&P 500 Weekly Forecast service.
| Title: | Market consultant and writer |
| Company: | Trendzetterz |
| Address: | 81 Hickory Hollow Drive |
| Crossville, TN 38555 | |
| Phone # for sales: | 904-303-4814 |
| Website: | trendzetterz.com |
| E-mail address: | support@trendzetterz.com |
Traders' Resource Links | |
| Trendzetterz has not added any product or service information to TRADERS' RESOURCE. | |
Click here for more information about our publications!
PRINT THIS ARTICLE

Request Information From Our Sponsors
- StockCharts.com, Inc.
- Candle Patterns
- Candlestick Charting Explained
- Intermarket Technical Analysis
- John Murphy on Chart Analysis
- John Murphy's Chart Pattern Recognition
- John Murphy's Market Message
- MurphyExplainsMarketAnalysis-Intermarket Analysis
- MurphyExplainsMarketAnalysis-Visual Analysis
- StockCharts.com
- Technical Analysis of the Financial Markets
- The Visual Investor
- VectorVest, Inc.
- Executive Premier Workshop
- One-Day Options Course
- OptionsPro
- Retirement Income Workshop
- Sure-Fire Trading Systems (VectorVest, Inc.)
- Trading as a Business Workshop
- VectorVest 7 EOD
- VectorVest 7 RealTime/IntraDay
- VectorVest AutoTester
- VectorVest Educational Services
- VectorVest OnLine
- VectorVest Options Analyzer
- VectorVest ProGraphics v6.0
- VectorVest ProTrader 7
- VectorVest RealTime Derby Tool
- VectorVest Simulator
- VectorVest Variator
- VectorVest Watchdog