

HOT TOPICS LIST
- MACD
- Fibonacci
- RSI
- Gann
- ADXR
- Stochastics
- Volume
- Triangles
- Futures
- Cycles
- Volatility
- ZIGZAG
- MESA
- Retracement
- Aroon
INDICATORS LIST
LIST OF TOPICS
PRINT THIS ARTICLE
by Donald W. Pendergast, Jr.
Shares of Whole Foods Market are moving lower on several time frames, suggesting larger declines to come.
Position: N/A
Donald W. Pendergast, Jr.
Freelance financial markets writer and online publisher of the Trendzetterz.com S&P 500 Weekly Forecast service.
PRINT THIS ARTICLE
BREAKOUTS
Whole Foods Market Breaking Lower
01/03/14 04:48:55 PMby Donald W. Pendergast, Jr.
Shares of Whole Foods Market are moving lower on several time frames, suggesting larger declines to come.
Position: N/A
| The search for stocks that are staging notable bullish or bearish breakouts is easier if you use a set of basic guidelines. Here's a look at one stock that is moving sharply lower on numerous intraday (and daily) time frames along with the simple steps needed to locate it and confirm if it's a worthy trading candidate or not. |
|
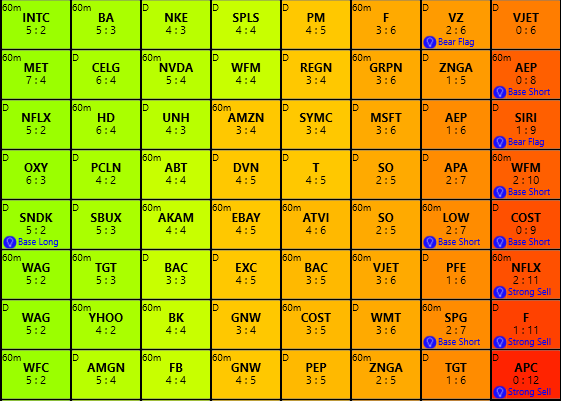
| Figure 1. During morning trading on Friday December 27, 2013, the KnowVera Trend Monitor identified Whole Foods Market (WFM) as a potential short selling candidate on its 60-minute time frame. |
| Graphic provided by: Phantom Trader by KnowVera Research LLC. |
| |
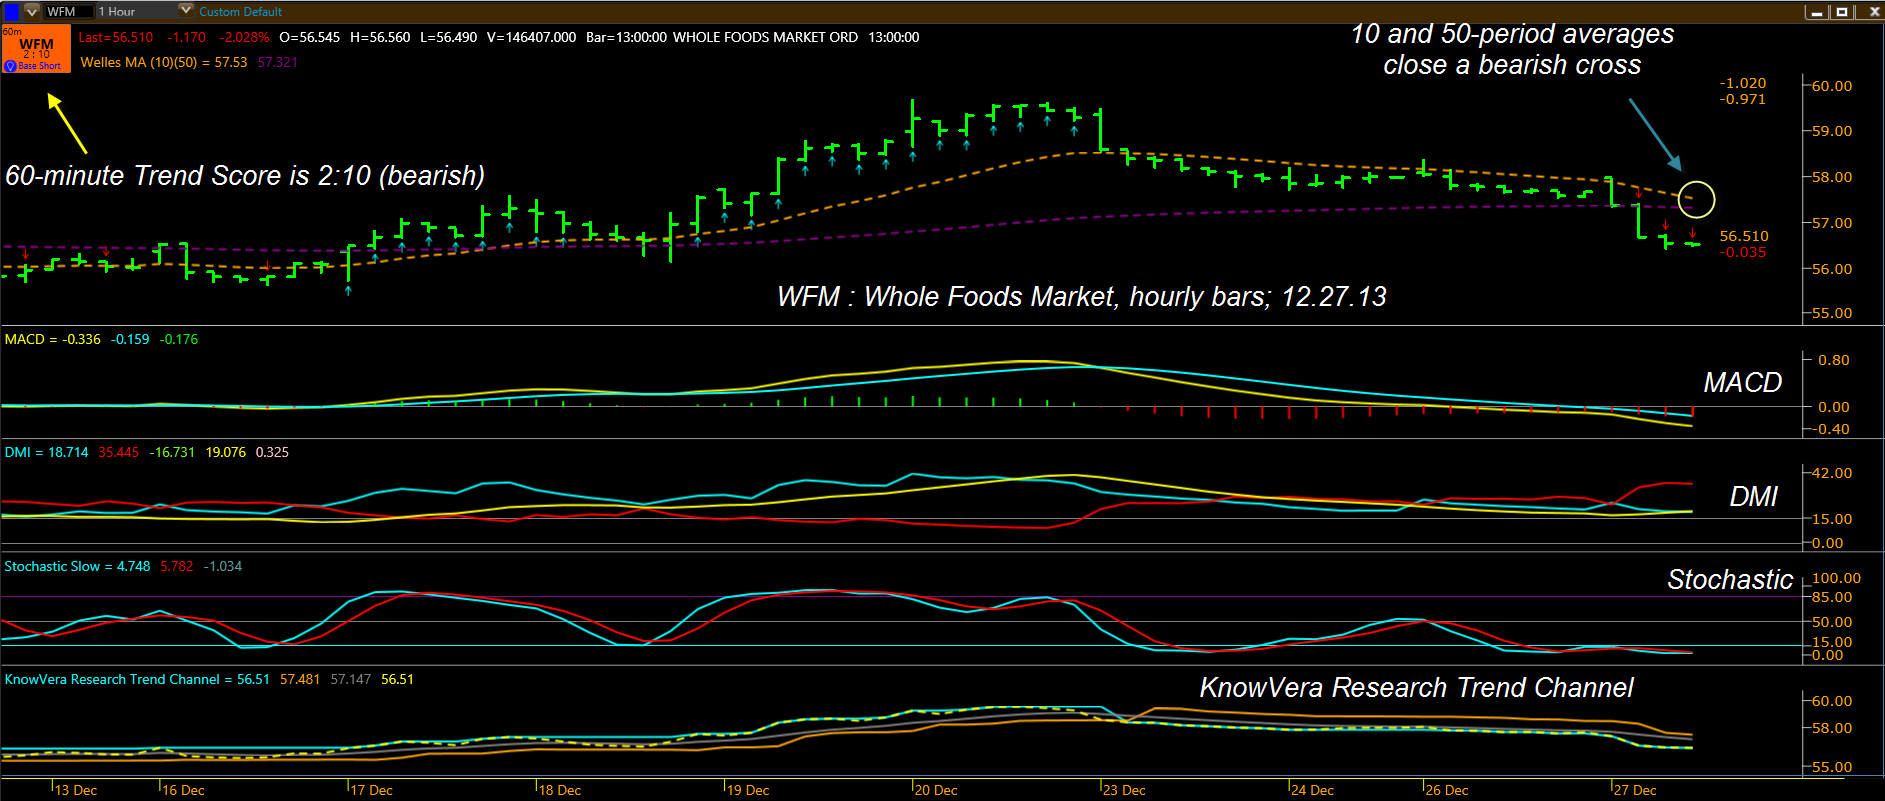
| The Phantom Trader trading platform comes with a scanning feature — known as the KnowVera Trend Monitor (KVTM) — that makes the process of finding trading candidates (on five different trading time frames) in the stock, ETF, currency, and commodities market painless and time-efficient. Routine scanning of the KTVM during the morning trading session on Friday December 27, 2013 revealed that shares of Whole Foods Market (WFM) were listed as a "base short" stock trading candidate on the 60-minute time frame, with a bearish 2:10 score (Figure 1). The cell with the stock ticker is colored red, also confirming the bearish bias for the 60-minute time frame. Clicking on the cell brings up a Phantom Trader chart for WFM; notice the following technical dynamics at work on its hourly chart (Figure 2): 1. The MACD is bearish, with a widening spread. 2. The Directional Movement Index (DMI) has also gone bearish. 3. The KnowVera Research Trend Channel (KVRTC) has also turned negative, confirming the down trend. 4. There are also three small red arrows atop the three most recent hourly price bars; these confirm that the Average Directional Movement Index (ADX) is strengthening. We have a clear bearish trend in play on WFM's 60-minute time frame — so now what? Should a trader just jump in and short WFM on the 60-minute time frame, hoping that this strong bearish trend will push prices even lower over the next few hourly price bars? Or should a trader wait for a minor pullback and then attempt a short entry at a better price? Here's a relatively low-risk, high reward idea on how to make the most of these kinds of setups. |
|
| Figure 2. WFM's hourly chart reveals bearish MACD, DMI, ADX and Trend Channel dynamics; waiting for a minor retracement on a smaller time frame may provide a safer and potentially more profitable price zone in which to initiate a short sale entry. |
| Graphic provided by: Phantom Trader by KnowVere Research LLC. |
| |
| The safest and lowest-risk way to play this emerging bear trend in WFM (on this particular time frame) is to simply do the following: A. Drop down to a 15- or 20-minute time frame chart and see if WFM pulls back toward the 1-period average (gold dashed line). B. If the stock retraces fairly close to the average and then begins to decline again, make sure the hourly MACD, DMI and trend channel is still negative. C.If the 20-minute trend channel is still negative, once you see the 20-minute stochastic make a new bearish cross, that would be your sell short signal in the stock. Assuming a hypothetical short entry near 56.60 and an initial stop loss just above the 10-bar average on the 20-minute chart (near 57.05) the risk-reward ratio of this trade comes out to be approximately 2.5 to 1 if using the strong support area near 55.75 as your profit target for the short sale. The KVRTC on the 20-minute chart can be used as a trailing stop guide for the duration of the trade, providing an objective means of closing out the trade for a profit or loss. There are many ways to use technical tools to time an effective (profitable) short trade, but this is still one of the safest, lowest risk, highest reward methods to accomplish this. Traders using daily and weekly charts could also use relative strength and fundamentals to help find great shorting candidates as we head into 2014, which is very likely a year in which short-sellers are likely to have abundant opportunities to cash in as the markets decline back toward more sane valuations. Trade wisely until we meet here again. |
Freelance financial markets writer and online publisher of the Trendzetterz.com S&P 500 Weekly Forecast service.
| Title: | Market consultant and writer |
| Company: | Trendzetterz |
| Address: | 81 Hickory Hollow Drive |
| Crossville, TN 38555 | |
| Phone # for sales: | 904-303-4814 |
| Website: | trendzetterz.com |
| E-mail address: | support@trendzetterz.com |
Traders' Resource Links | |
| Trendzetterz has not added any product or service information to TRADERS' RESOURCE. | |
Click here for more information about our publications!
PRINT THIS ARTICLE

Request Information From Our Sponsors
- StockCharts.com, Inc.
- Candle Patterns
- Candlestick Charting Explained
- Intermarket Technical Analysis
- John Murphy on Chart Analysis
- John Murphy's Chart Pattern Recognition
- John Murphy's Market Message
- MurphyExplainsMarketAnalysis-Intermarket Analysis
- MurphyExplainsMarketAnalysis-Visual Analysis
- StockCharts.com
- Technical Analysis of the Financial Markets
- The Visual Investor
- VectorVest, Inc.
- Executive Premier Workshop
- One-Day Options Course
- OptionsPro
- Retirement Income Workshop
- Sure-Fire Trading Systems (VectorVest, Inc.)
- Trading as a Business Workshop
- VectorVest 7 EOD
- VectorVest 7 RealTime/IntraDay
- VectorVest AutoTester
- VectorVest Educational Services
- VectorVest OnLine
- VectorVest Options Analyzer
- VectorVest ProGraphics v6.0
- VectorVest ProTrader 7
- VectorVest RealTime Derby Tool
- VectorVest Simulator
- VectorVest Variator
- VectorVest Watchdog