

HOT TOPICS LIST
- MACD
- Fibonacci
- RSI
- Gann
- ADXR
- Stochastics
- Volume
- Triangles
- Futures
- Cycles
- Volatility
- ZIGZAG
- MESA
- Retracement
- Aroon
INDICATORS LIST
LIST OF TOPICS
PRINT THIS ARTICLE
by Donald W. Pendergast, Jr.
Deteriorating earnings growth rates in the US stock market suggest that another decline is overdue.
Position: N/A
Donald W. Pendergast, Jr.
Freelance financial markets writer and online publisher of the Trendzetterz.com S&P 500 Weekly Forecast service.
PRINT THIS ARTICLE
CHART ANALYSIS
Stock Earnings Trends Suggest A Pullback Likely
01/02/14 03:27:37 PMby Donald W. Pendergast, Jr.
Deteriorating earnings growth rates in the US stock market suggest that another decline is overdue.
Position: N/A
| Performing a scan of recent earnings trends in a stock may be a big help to traders, especially after major market advances or declines. Here's a look at the recent earnings and technical situation in one of the shares of the Dow 30 Industrial manufacturing giants – Dupont (E.I) Denemours. |
|
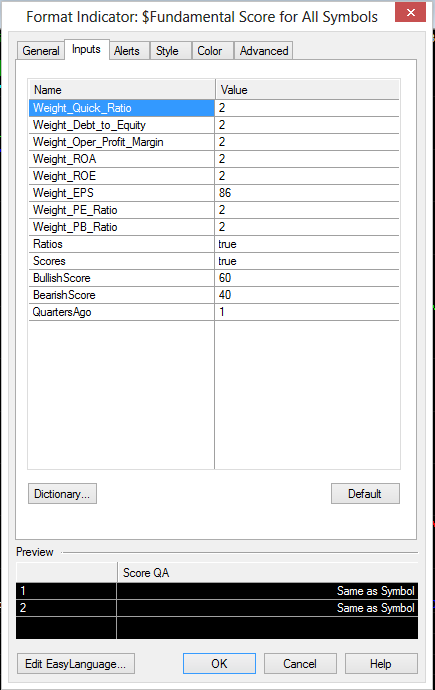
| Figure 1. The 'Fundamental Score Indicator' for TradeStation 9.1 allows a full range of adjustments to the various input parameters; here, the 'Weight_EPS' input is set extremely high to allow the output to be influenced mostly by the recent quarterly earnings trend in the stock. |
| Graphic provided by: TradeStation. |
| Graphic provided by: TradeStation Fundamental Score Indicator. |
| |
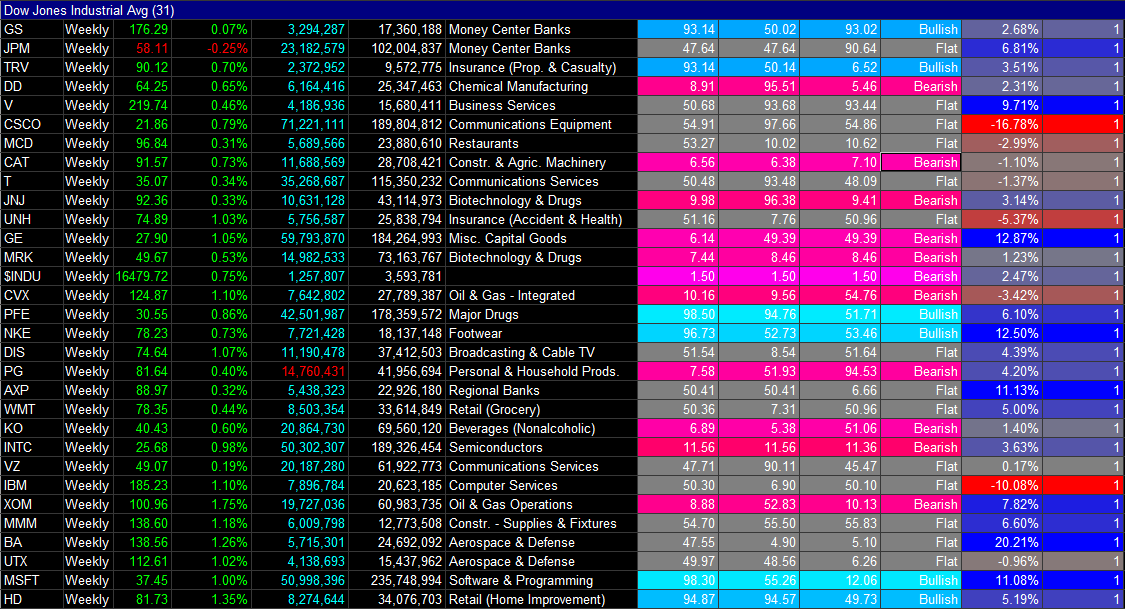
| TradeStation users have access to a variety of screens prebuilt to analyze a variety of technical and fundamental data for a given stock, industry group or sector and one of the best ones is built around the "Fundamental Score Indicator." This indicator measures a variety of fundamentals such as the earnings per share, quick ratio, debt-to-equity ratio and five other key fundies and using a pre-set formula that determines if the stock is in one of three modes – bullish, bearish or flat. The standard input parameters work great as-is, but are also adjustable for those users who wish to home in on a particular fundamental by giving it more weight in the ranking formula. I adjusted the 'Weight_EPS' input to '86' and set all of the other seven inputs to '2' to put a very high weight on the recent quarterly earnings trend in these particular groups of stocks (Figure 2): 1. Nasdaq 100 index components (QQQ, .NDX) 2. Dow 30 Industrials components (DIA, .DJIA) 3. Oil service components (OIH, IEZ) 4. A diverse mix of metal mining stocks The output of the screens is color-coded to aid in quick visual screening; red to pink colors indicate a bearish fundamental outlook, gray colors indicate a "flat" (neutral) outlook and blue to cyan shading indicates a bullish fundamental outlook (Figure 2). Remember, in this example, the output is heavily weighted toward the stock's recent quarterly earnings trend. The results are fascinating; * Nasdaq 100 stocks: 41 are bearish, 26 are bullish and 33 are neutral. * Dow 30 stocks: 10 are bearish, six are bullish and 14 are neutral. * Oil services stocks: seven are bearish, two are bullish and four are neutral. * Metals mix stocks: 12 are bearish and three are bullish. So, based mostly on recent quarterly earnings trends, there is a decidedly neutral-to-bearish quarterly earnings bias at work now, one that needs to get far more bullish if the streak of new highs in the major US stock indexes is to continue. The negative bias in the Nasdaq 100 is particularly troubling, given the big run-up in tech-related issues since mid-November 2012. The Dow 30 is nearly as bearish, so for this article I decided to locate a Dow 30 stock with a poor fundamental (earnings) score that has also far outperformed the S&P 500 index (.SPX) over the past 52 week period; the stock with the most extreme measures in both categories is Dupont (E.I.) Denemours (DD). The fundamental score is only 8.90 (1.00 being worst and 100 being best) even though the stock has managed to beat the performance of the .SPX by more than 10% over the past year. Interestingly, of the six Dow 30 stocks that ranked higher in 52-week relative strength vs. the .SPX, only one of those has a bullish earnings score; the other five are all ranked as "flat" (neutral). This appears to be a good confirmation that distribution is underway in the Dow 30 Industrials, especially with new highs still being made nearly five years into an epic bull market rally. |
|
| Figure 2. The Fundamental Score Indicator is the key component of a comprehensive set of fundamental analysis tools in TradeStation's RadarScreen. The color coding of output makes ranking and sorting of stocks very quick and easy. |
| Graphic provided by: TradeStation. |
| Graphic provided by: TradeStation Radar Screen. |
| |
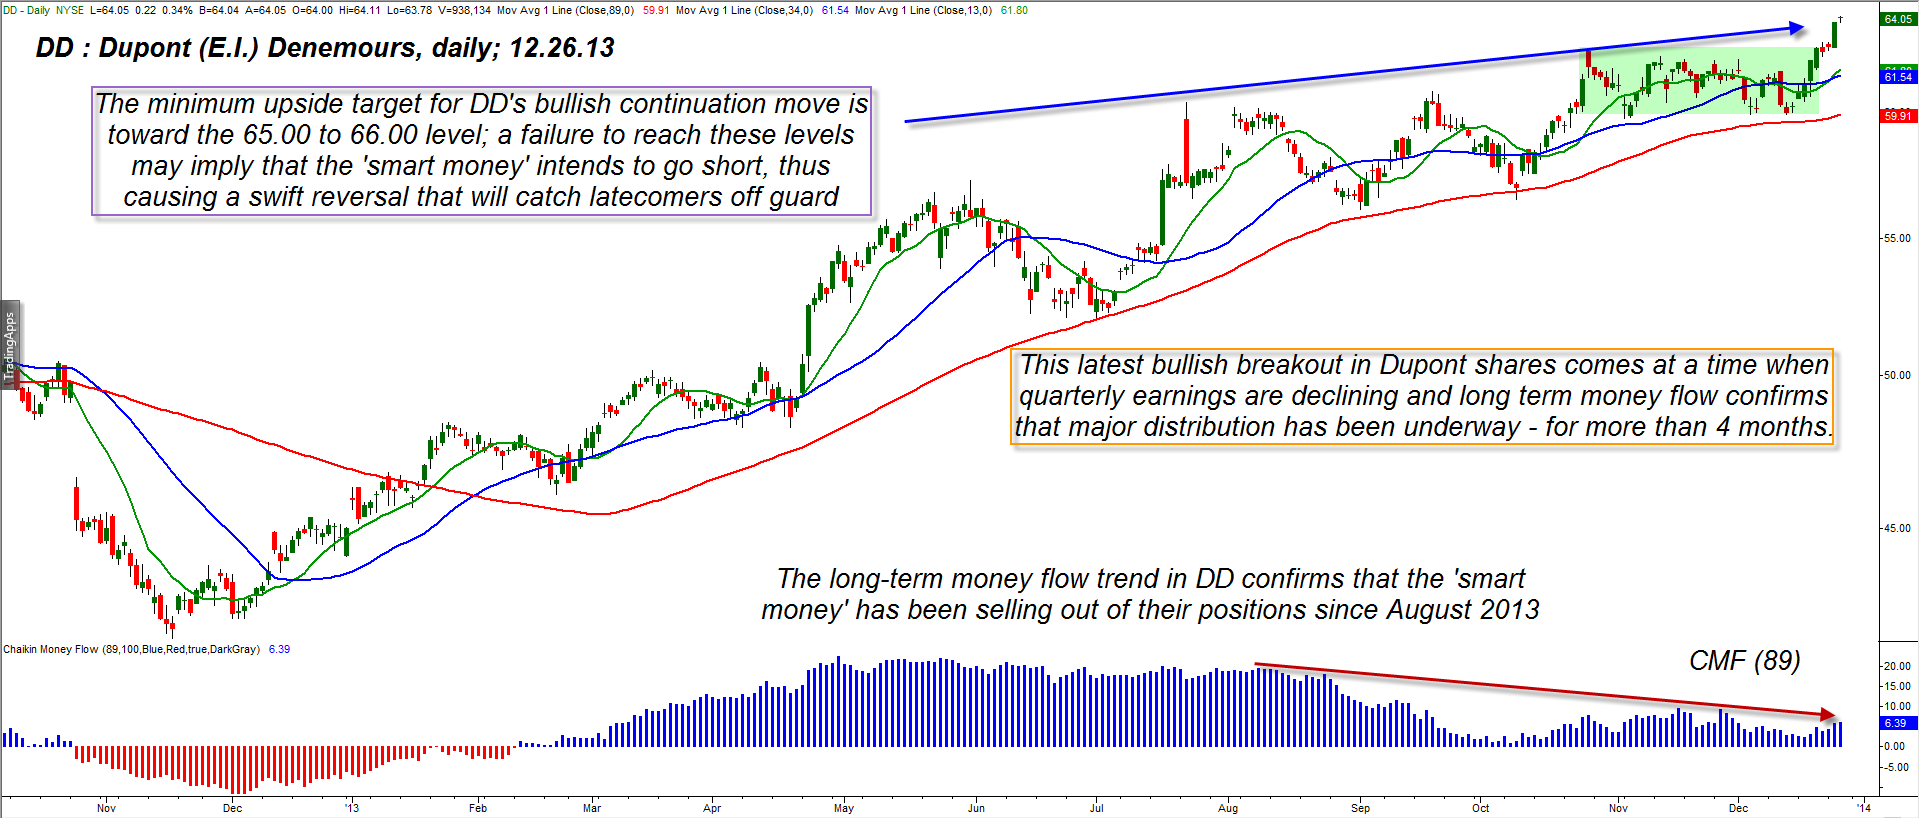
| Pulling up a daily chart off DD (Figure 3), the first thing to notice is the bearish trend of the 89-day Chaikin Money flow (CMF)(89) histogram; it has been declining rapidly since the latter half of August 2013 even as DD has continued to grind higher. This is proof positive that the "smart money" has been steadily unloading their long positions in the stock, distributing it into the hands of novice investors and other latecomers to the party. And now that DD has just broken higher from a consolidation pattern (green shaded zone), the stage has been set for either an epic "fakeout" move higher or a true bullish continuation move. Based on minimum price pattern targets, if DD fails to reach 65.00 to 66.00 in the next couple of weeks, expect the "smart money" to start short selling DD, thus scaring the latecomers into panicking and bailing out; if this happens, expect a fast move back down toward the red 89-day moving average (SMA). Given the heavy distribution pattern and poor earnings trend for DD, this is a likely possibility in the next week or two. However, if DD can bust above 66.00 to 67.00 even as the Dow 30 and .SPX also make new highs, then the continuation move will have been deemed a success. The bottom line here is that DD is vulnerable to a sizable correction for as long as the money flow and earnings trend remains in bearish mode. Consider using any bullish breakouts to lighten up your DD long position if not to sell out altogether. This rally looks like it's running on borrowed time, along with most other large cap issues as we sail into 2014. Trade wisely until we meet here again. |
|
| Figure 3. Dupont's (DD) bull run has been substantial, but so has its bearish long-term money flow trend since late summer 2013. If the stock fails to hit 65.00 to 66.00 soon, the likelihood of a correction increases dramatically. |
| Graphic provided by: TradeStation. |
| |
Freelance financial markets writer and online publisher of the Trendzetterz.com S&P 500 Weekly Forecast service.
| Title: | Market consultant and writer |
| Company: | Trendzetterz |
| Address: | 81 Hickory Hollow Drive |
| Crossville, TN 38555 | |
| Phone # for sales: | 904-303-4814 |
| Website: | trendzetterz.com |
| E-mail address: | support@trendzetterz.com |
Traders' Resource Links | |
| Trendzetterz has not added any product or service information to TRADERS' RESOURCE. | |
Click here for more information about our publications!
Comments
Date:�01/02/14Rank:�5Comment:�Very insightful.

Request Information From Our Sponsors
- StockCharts.com, Inc.
- Candle Patterns
- Candlestick Charting Explained
- Intermarket Technical Analysis
- John Murphy on Chart Analysis
- John Murphy's Chart Pattern Recognition
- John Murphy's Market Message
- MurphyExplainsMarketAnalysis-Intermarket Analysis
- MurphyExplainsMarketAnalysis-Visual Analysis
- StockCharts.com
- Technical Analysis of the Financial Markets
- The Visual Investor
- VectorVest, Inc.
- Executive Premier Workshop
- One-Day Options Course
- OptionsPro
- Retirement Income Workshop
- Sure-Fire Trading Systems (VectorVest, Inc.)
- Trading as a Business Workshop
- VectorVest 7 EOD
- VectorVest 7 RealTime/IntraDay
- VectorVest AutoTester
- VectorVest Educational Services
- VectorVest OnLine
- VectorVest Options Analyzer
- VectorVest ProGraphics v6.0
- VectorVest ProTrader 7
- VectorVest RealTime Derby Tool
- VectorVest Simulator
- VectorVest Variator
- VectorVest Watchdog