HOT TOPICS LIST
- MACD
- Fibonacci
- RSI
- Gann
- ADXR
- Stochastics
- Volume
- Triangles
- Futures
- Cycles
- Volatility
- ZIGZAG
- MESA
- Retracement
- Aroon
INDICATORS LIST
LIST OF TOPICS
PRINT THIS ARTICLE
by Koos van der Merwe
December 21st is the solstice and in the Northern Hemisphere, December 22nd is the start of Winter.
Position: Sell
Koos van der Merwe
Has been a technical analyst since 1969, and has worked as a futures and options trader with First Financial Futures in Johannesburg, South Africa.
PRINT THIS ARTICLE
CYCLES
The Solstice
12/31/13 04:35:17 PMby Koos van der Merwe
December 21st is the solstice and in the Northern Hemisphere, December 22nd is the start of Winter.
Position: Sell
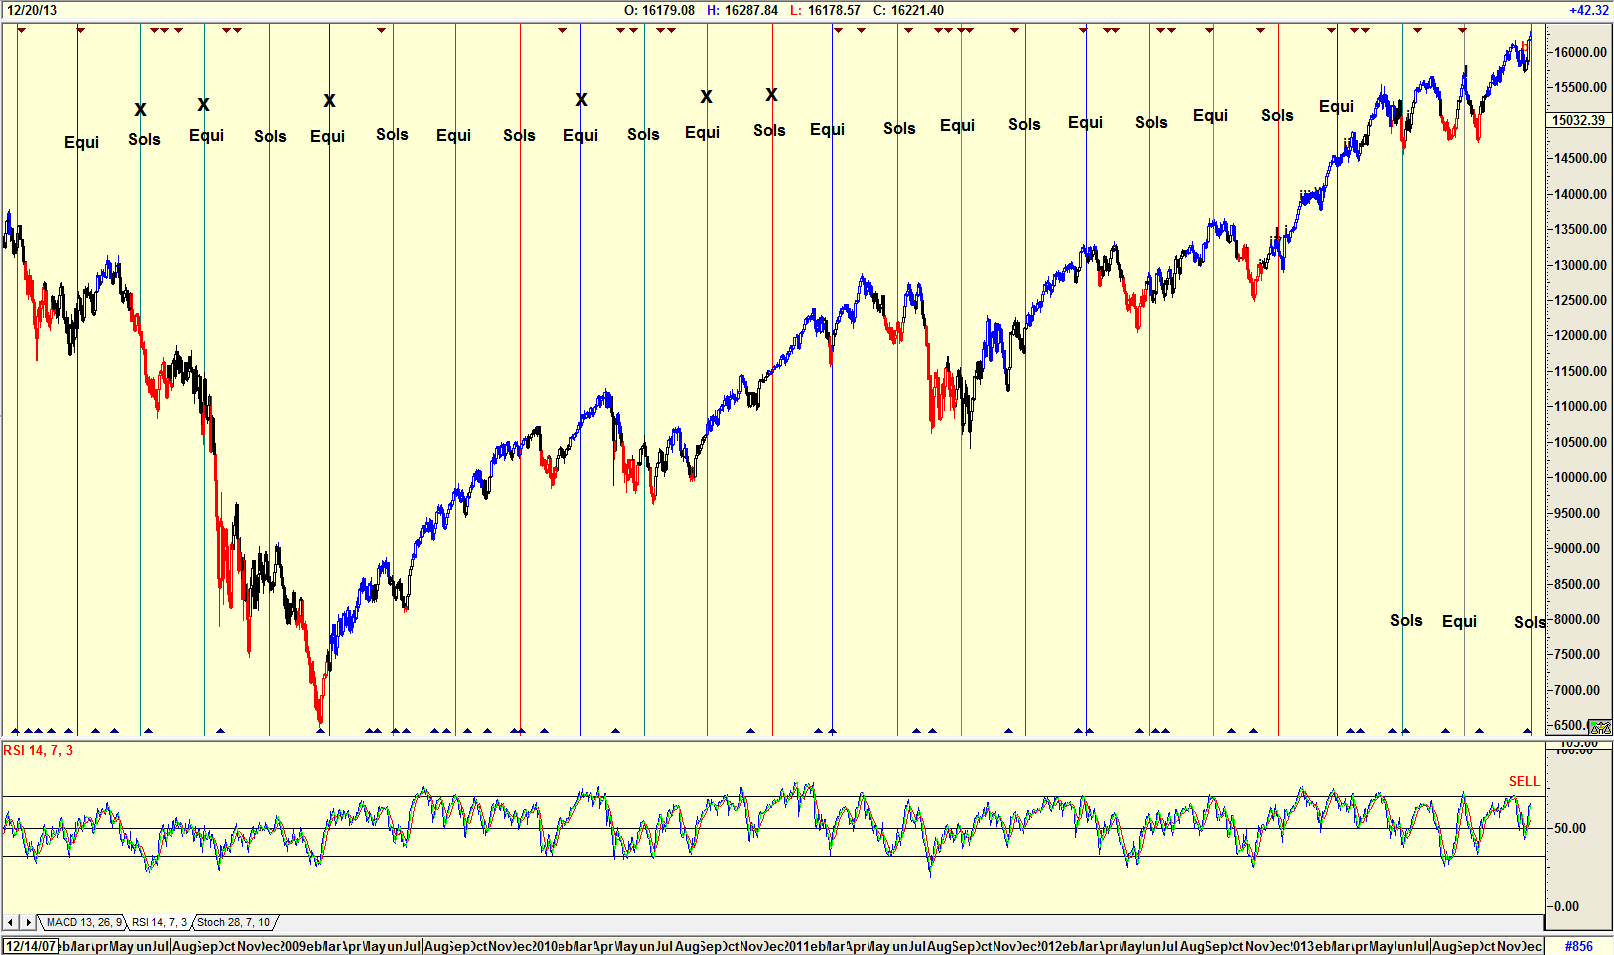
| December 21st is the solstice, the shortest day of the year, and also a day WD GANN regarded as a turning point in the market. He would look at the equinoxes and solstices as possible turning points, and adjust his trades accordingly. How accurate was he in his assumption, and if so, with December 21st on hand, does this mean that we can now see a correction in the Dow? |

|
| Figure 1. Daily chart of the Dow showing Solstice and Equinox. |
| Graphic provided by: AdvancedGET. |
| |
| The chart in Figure 1 is a daily chart of the Dow Jones from December 2007 to December 2013. The chart shows the equinoxes and solstices. The chart shows an 'X' where a turning point, either positive or negative did not occur. Out of 24 vertical lines drawn on the equinox and solstice dates, only six dates did not have Dow corrections. In some instances, the corrections were minor, in others major. In some cases major corrections occurred close to either the equinox or the solstice. |

|
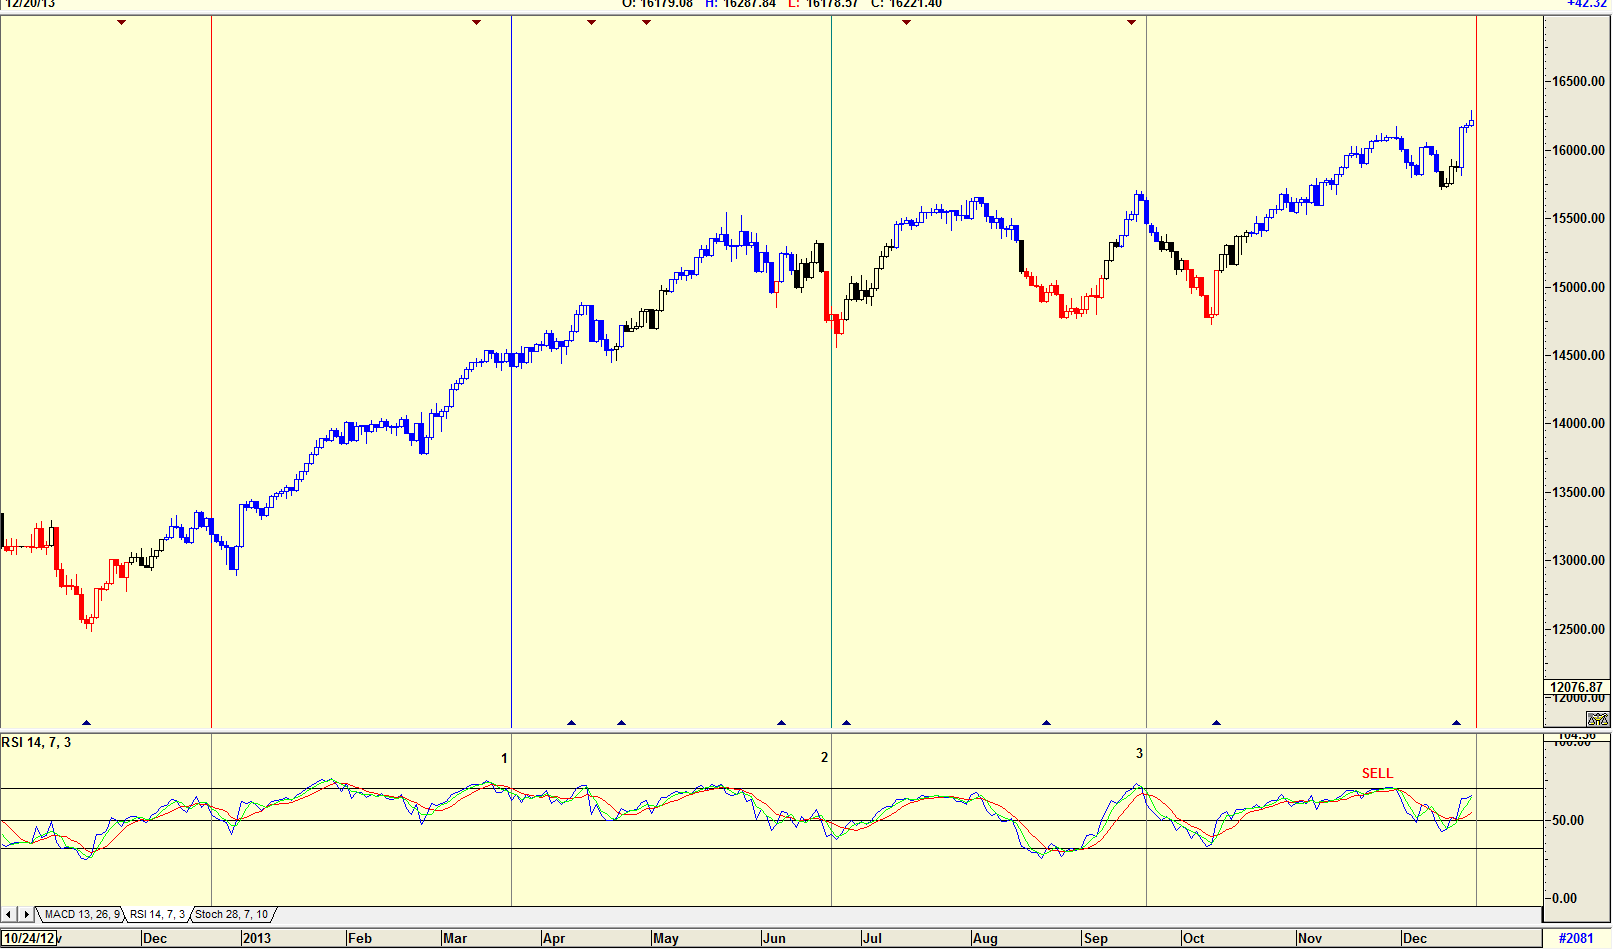
| Figure 2. Daily chart enlarged showing the Dow equinox and solstice over one year |
| Graphic provided by: AdvancedGET. |
| |
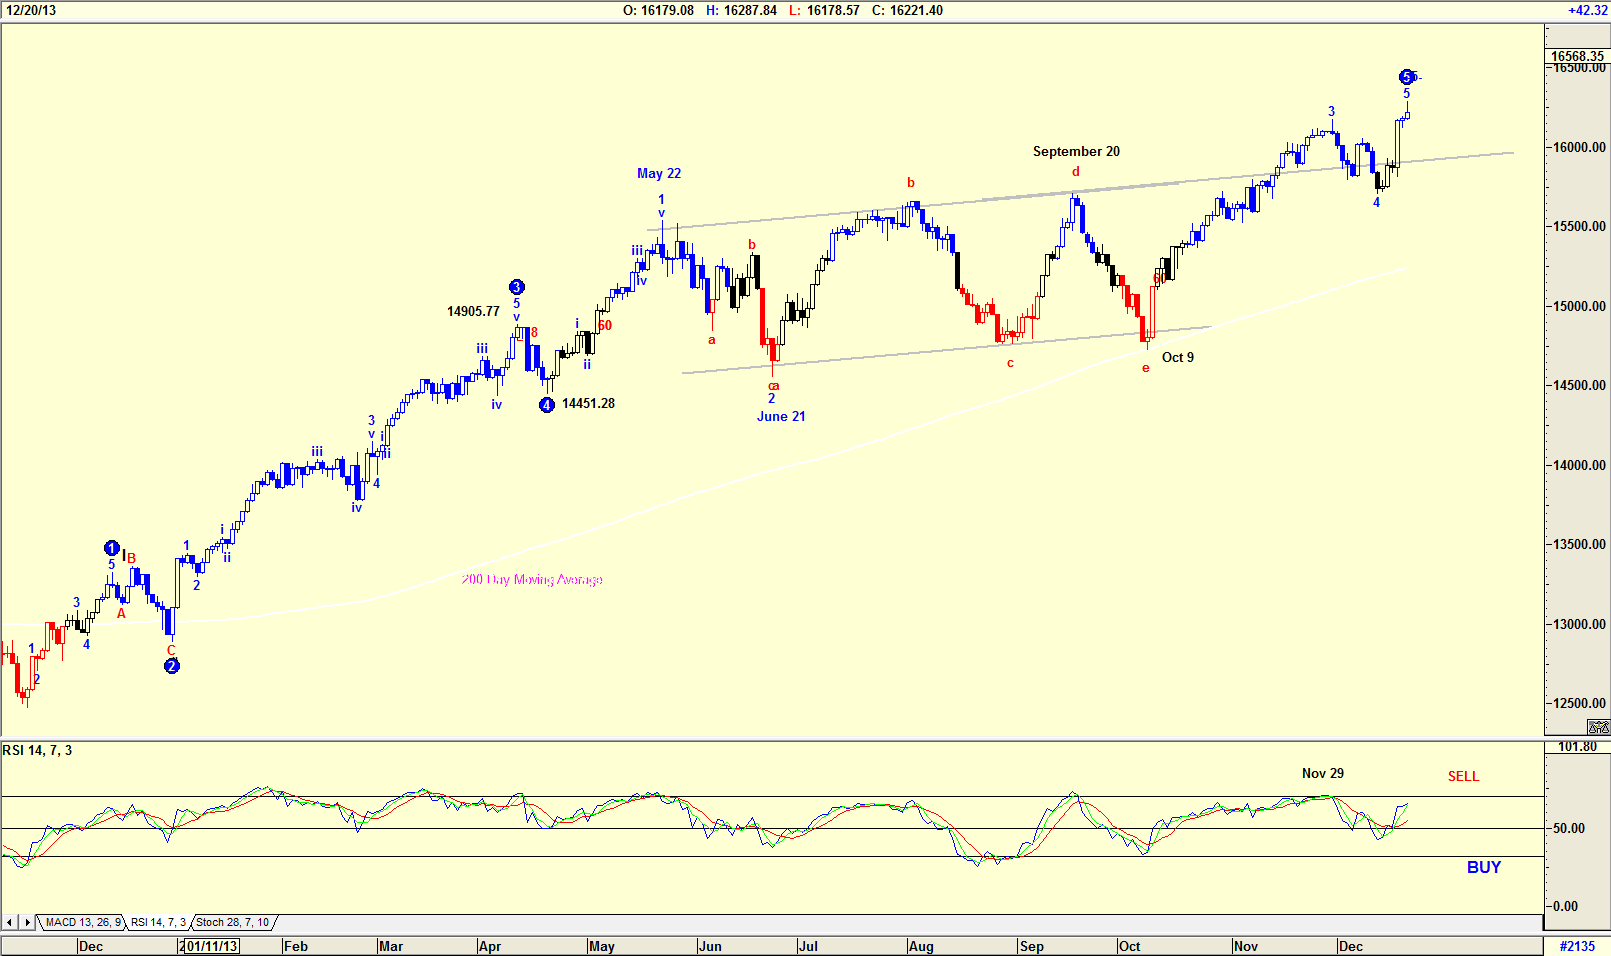
| The chart in Figure 3 is an Elliott Wave count of the Dow suggesting that the Dow could be completing a WAVE 5 top. This means that the correction, if there, will be to the 4th wave of lesser degree, around about the 14451 - 14905 level. The RSI indicator gave a sell signal on November 29, 2013 but started strengthening from the 50 level. Should it start turning down, then it will have given a divergence sell, that is where the Dow makes a higher high and the RSI a lower sell signal. Note how the Dow tested the 200-day moving average on October 9, 2013 suggesting that in correcting to the 4th Wave of lesser degree, the Dow could fall below the 200-day moving average, shouting a major correction to those technicians watching the Dow. Yes, if one should believe in WD Gann's theory of Dow turning points on solstices and equinoxes, and there are many, especially computers that don't, then we could expect to see the Dow start falling over the next few days. Whether WD Gann's theory is correct or not, I would not be a buyer of stocks at the moment, more likely a seller. |

|
| Figure 3. Elliott Wave count of the Dow suggesting a correction. |
| Graphic provided by: AdvancedGET. |
| |
| With more and more computers trading the market, the likelihood of emotional trading on the days of the equinox or solstice is more and more unlikely, yet remarkably corrections still occur. Figure 2 is an enlargement of Figure 1 from December 2012 to December 2013. Notice how corrections occurred within one or two days of the solstice or equinox . Note also that out of the five signals given, the RSI indicator supported only three corrections. Does this mean that the Dow will correct in the coming week. It definitely looks like it. Whether the correction will be a major one or a minor one depends on an Elliott Wave count as shown in Figure 3. |
Has been a technical analyst since 1969, and has worked as a futures and options trader with First Financial Futures in Johannesburg, South Africa.
| Address: | 3256 West 24th Ave |
| Vancouver, BC | |
| Phone # for sales: | 6042634214 |
| E-mail address: | petroosp@gmail.com |
Click here for more information about our publications!
Comments

Request Information From Our Sponsors
- StockCharts.com, Inc.
- Candle Patterns
- Candlestick Charting Explained
- Intermarket Technical Analysis
- John Murphy on Chart Analysis
- John Murphy's Chart Pattern Recognition
- John Murphy's Market Message
- MurphyExplainsMarketAnalysis-Intermarket Analysis
- MurphyExplainsMarketAnalysis-Visual Analysis
- StockCharts.com
- Technical Analysis of the Financial Markets
- The Visual Investor
- VectorVest, Inc.
- Executive Premier Workshop
- One-Day Options Course
- OptionsPro
- Retirement Income Workshop
- Sure-Fire Trading Systems (VectorVest, Inc.)
- Trading as a Business Workshop
- VectorVest 7 EOD
- VectorVest 7 RealTime/IntraDay
- VectorVest AutoTester
- VectorVest Educational Services
- VectorVest OnLine
- VectorVest Options Analyzer
- VectorVest ProGraphics v6.0
- VectorVest ProTrader 7
- VectorVest RealTime Derby Tool
- VectorVest Simulator
- VectorVest Variator
- VectorVest Watchdog
