HOT TOPICS LIST
- MACD
- Fibonacci
- RSI
- Gann
- ADXR
- Stochastics
- Volume
- Triangles
- Futures
- Cycles
- Volatility
- ZIGZAG
- MESA
- Retracement
- Aroon
INDICATORS LIST
LIST OF TOPICS
PRINT THIS ARTICLE
by Kevin Hopson
Apache Corp. (APA) broke a significant top in the $57.00 to $58.00 range last month. The positive relative strength and shakeout pattern indicated a further move to the upside.
Position: Hold
Kevin Hopson
Kevin has been a technical analyst for roughly 10 years now. Previously, Kevin owned his own business and acted as a registered investment advisor, specializing in energy. He was also a freelance oil analyst for Orient Trading Co., a commodity futures trading firm in Japan. Kevin is currently a freelance writer.
PRINT THIS ARTICLE
SHAKE-OUTS
Apache Corp. Offers a Good Example of a Shakeout Pattern
10/02/02 10:23:41 AMby Kevin Hopson
Apache Corp. (APA) broke a significant top in the $57.00 to $58.00 range last month. The positive relative strength and shakeout pattern indicated a further move to the upside.
Position: Hold
| Apache Corp. (APA), an oil and natural gas exploration and production company, has significantly outperformed the market over the last year. While the Dow, S&P 500 and Nasdaq all took out their September 2001 lows back in July, Apache Corp. did not even come close. More specifically, Apache bottomed out in the $45.00 to $46.00 range back in July, much higher than its September 2001 low around $35.00/share. |
| Additionally, in recent days Apache has been making a run at its 52-week high ($60.09), while the major indices have proceeded to test and/or break recent lows. As a result, Apache is an excellent example of the type of company to look for in a bear market. They have had a couple of significant technical developments over the past few weeks that signaled a potential move higher. |

|
| Graphic provided by: Stochcharts.com. |
| |
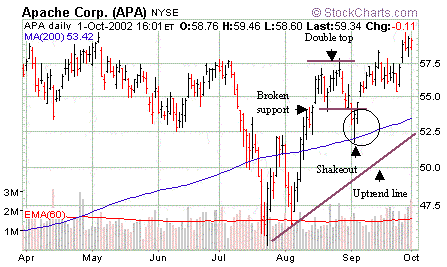
| First, there was a shakeout pattern in early September. To elaborate, a shakeout pattern develops when a stock fails to significantly break a prior top and then proceeds to give a short-term sell signal. What differentiates a shakeout pattern from other double top formations are the following: 1) The stock is in a clear uptrend and is trading above its trendline, 2) The long-term relative strength is positive and 3) The stock has not given a sell signal prior to the shakeout. |
| By looking for these technical characteristics, investors can identify a shakeout pattern and be more confident that prices will reverse back up. For example, if you look at the chart on Apache, you will see that the stock formed a double top in the $57.00 to $58.00 range during the month of August. This came after the July lows so the stock was in a clear uptrend. |
| In addition, Apache did not give a sell signal (breach a prior low) until the stock broke support in the $53.00 to $54.00 range early last month. This completed the shakeout pattern. Coincidentally, Apache's long-term relative strength gave a buy signal on September 16, confirming the potential move up. As you can see, the stock found support along its 200-day moving average (down around the $52.00 level) and proceeded to break a significant top in the $57.00 to $58.00 range, eventually making its way up to the $60.00 level. |
Kevin has been a technical analyst for roughly 10 years now. Previously, Kevin owned his own business and acted as a registered investment advisor, specializing in energy. He was also a freelance oil analyst for Orient Trading Co., a commodity futures trading firm in Japan. Kevin is currently a freelance writer.
| Glen Allen, VA | |
| E-mail address: | hopson_1@yahoo.com |
Click here for more information about our publications!
Comments
Date: 10/23/02Rank: 5Comment: I ve encountered this pattern before so am familiar with it but have never been able to quantify as well as you. Thanks

Request Information From Our Sponsors
- StockCharts.com, Inc.
- Candle Patterns
- Candlestick Charting Explained
- Intermarket Technical Analysis
- John Murphy on Chart Analysis
- John Murphy's Chart Pattern Recognition
- John Murphy's Market Message
- MurphyExplainsMarketAnalysis-Intermarket Analysis
- MurphyExplainsMarketAnalysis-Visual Analysis
- StockCharts.com
- Technical Analysis of the Financial Markets
- The Visual Investor
- VectorVest, Inc.
- Executive Premier Workshop
- One-Day Options Course
- OptionsPro
- Retirement Income Workshop
- Sure-Fire Trading Systems (VectorVest, Inc.)
- Trading as a Business Workshop
- VectorVest 7 EOD
- VectorVest 7 RealTime/IntraDay
- VectorVest AutoTester
- VectorVest Educational Services
- VectorVest OnLine
- VectorVest Options Analyzer
- VectorVest ProGraphics v6.0
- VectorVest ProTrader 7
- VectorVest RealTime Derby Tool
- VectorVest Simulator
- VectorVest Variator
- VectorVest Watchdog
