

HOT TOPICS LIST
- MACD
- Fibonacci
- RSI
- Gann
- ADXR
- Stochastics
- Volume
- Triangles
- Futures
- Cycles
- Volatility
- ZIGZAG
- MESA
- Retracement
- Aroon
INDICATORS LIST
LIST OF TOPICS
PRINT THIS ARTICLE
by Donald W. Pendergast, Jr.
Tesla Motors shares may be ready to reverse lower again after its current B-wave bounce completes.
Position: N/A
Donald W. Pendergast, Jr.
Freelance financial markets writer and online publisher of the Trendzetterz.com S&P 500 Weekly Forecast service.
PRINT THIS ARTICLE
FIBONACCI
TSLA: B-Wave Bounce Done?
12/23/13 06:23:18 PMby Donald W. Pendergast, Jr.
Tesla Motors shares may be ready to reverse lower again after its current B-wave bounce completes.
Position: N/A
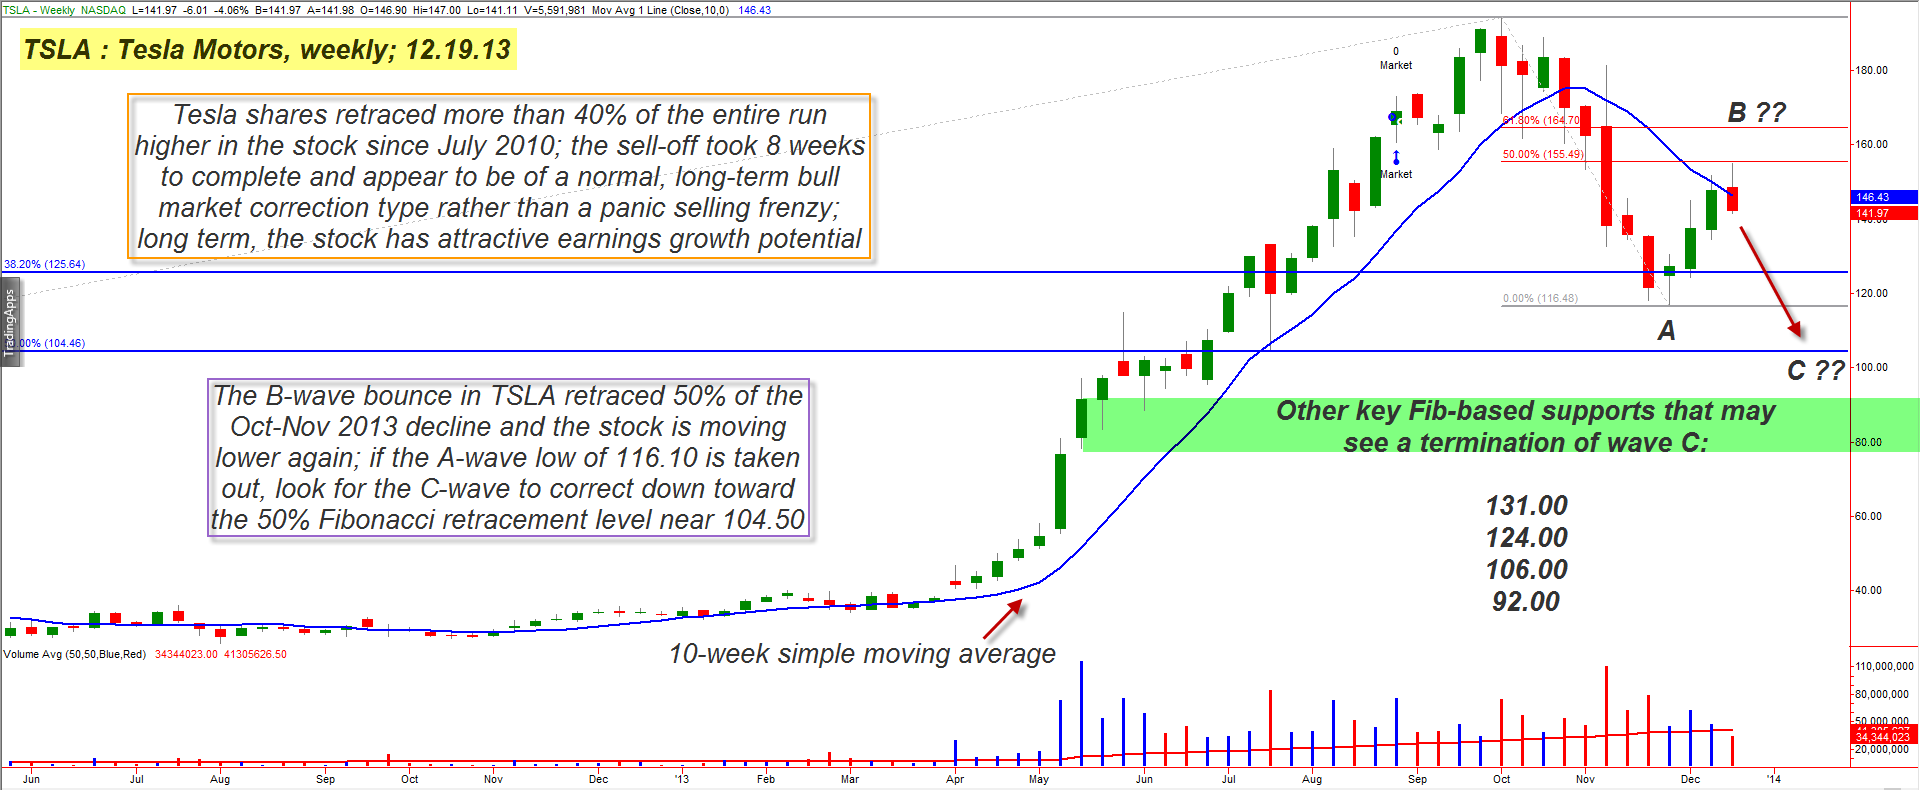
| Shares of Telsa Motors have bounced higher in the wake of its recent 40% sell-off - right into the 50% retracement resistance line of that October/November 2013 decline; with the stock now turning lower from the 155.00 area now, what might the ultimate washout low price be for an anticipated C-wave to complete? Here's a closer look. |
|
| Figure 1. Tesla Motors (TSLA) may be descending in a C-wave that will complete an ABC proportional correction of the stock's massive rally since April 2012. Several potential C-wave termination prices are listed on the chart. |
| Graphic provided by: TradeStation. |
| |
| The run higher in Tesla Motors shares (TSLA) since the shares began trading in July 2010 has been impressive; from its low of 14.98 the stock managed to make it to 194.50 per share in a little more than three years, with most of the big gains being made between April 2012 and October 2013. Obviously, a stock that has enjoyed such a terrific run-up will eventually correct, and the correction that ensued after the October 2013 high (wave A) was quite deep, but not exactly a "shock" long-term bullish trend decimating variety of decline. The chart in Figure 1 reveals that there was a fresh wave of buyers who stepped in to purchase TSLA down around the 116.00 to 125.00 area and that propelled the stock higher to 154.90 earlier this week; note however that the steep bounce reversed off of the Fibonacci 50% retracement of the October/November 2013 selloff and the 10-week simple moving average (SMA). As this is written, TSLA is now trading back near 141.00, nearly $14 below the B-wave high, and now looks set to decline further in the next few weeks. Here are the next set of ABC swing target projection prices for TSLA, all are based on key Fibonacci ratios: * 131.00 - based on a 62% retracement of swing AB * 124.00 - based on a 79% retracement of swing AB * 116.10 - based on a 100% retracement of swing AB * 106.00 - based on a 127% retracement of swing AB * 92.00 - based on a 162% retracement of swing AB Now, come on here - these are just a bunch of lines plotted on a chart, and one of them is bound to get hit at some time or another, right? Well, yes, that may be true, but there does seem to be plenty of statistical and anecdotal evidence to suggest that the above Fib ratios still do a good job of forecasting likely reversal points for various market swings. The most practical way to use these tentative support levels as TSLA's C-wave drops lower is simple, assuming that a bearish C-wave has indeed begun. If the 131.00 target is reached, does the stock find support and begin to turn higher again? Or does it simply keep declining? If it turns higher, look for a subsequent retrace on a 30- to 60-minute chart to help time a new long entry. If the stock falls thru 131.00, however, assume that the C-wave will want to test the next Fib retracement level (.786) near 124.00. As this level is approached, again observe if there is a bounce or if the stock just keeps dropping. Then repeat the process for each subsequent support level that is reached by the C-wave. As a general rule, if this C-wave terminates near 131.00 or 124.00, assume there are still plenty of willing buyers who believe that TSLA will run up to new highs sooner rather than later. And if the C-wave bottoms below 116.00, assume that it's going to take a lot of repair work for TSLA to get back above the 194.50 high during the first half of 2014. |
|
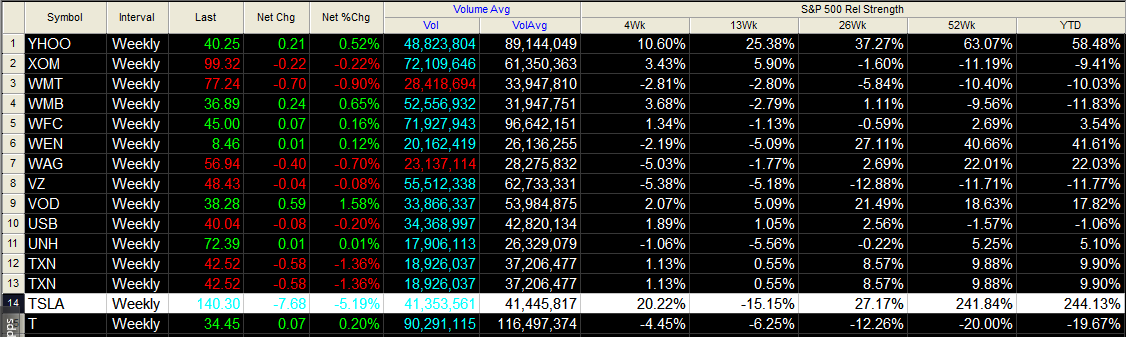
| Figure 2. TSLA is still outperforming the S&P 500 index (.SPX) by a massive amount over the past 52 weeks, despite its ongoing correction. |
| Graphic provided by: TradeStation. |
| Graphic provided by: TradeStation Radar Screen. |
| |
| Right now, TSLA does look like a modest-risk short, played as follows: On a drop below 140.00 short the shares (or buy a put with at least four to five months time value), using 131.00 as your initial profit target; if that is hit, take half profits and then take a quarter of the original position off at the next target at 124.00. Then for the remaining quarter of the original position, run a two to three bar trailing stop of the weekly highs until final stop out. Once you're fully out of the position and evidence exists that the C-wave is complete, begin looking for low-risk long entry points on the subsequent rallies that are likely to appear. Risk on this kind of trade should be modest, perhaps 1% of your account size; conservative traders might also want to take all profits by the time that the 131.00 and/or 124.00 support levels are reached. Trade wisely until we meet here again. |
Freelance financial markets writer and online publisher of the Trendzetterz.com S&P 500 Weekly Forecast service.
| Title: | Market consultant and writer |
| Company: | Trendzetterz |
| Address: | 81 Hickory Hollow Drive |
| Crossville, TN 38555 | |
| Phone # for sales: | 904-303-4814 |
| Website: | trendzetterz.com |
| E-mail address: | support@trendzetterz.com |
Traders' Resource Links | |
| Trendzetterz has not added any product or service information to TRADERS' RESOURCE. | |
Click here for more information about our publications!
Comments

Request Information From Our Sponsors
- StockCharts.com, Inc.
- Candle Patterns
- Candlestick Charting Explained
- Intermarket Technical Analysis
- John Murphy on Chart Analysis
- John Murphy's Chart Pattern Recognition
- John Murphy's Market Message
- MurphyExplainsMarketAnalysis-Intermarket Analysis
- MurphyExplainsMarketAnalysis-Visual Analysis
- StockCharts.com
- Technical Analysis of the Financial Markets
- The Visual Investor
- VectorVest, Inc.
- Executive Premier Workshop
- One-Day Options Course
- OptionsPro
- Retirement Income Workshop
- Sure-Fire Trading Systems (VectorVest, Inc.)
- Trading as a Business Workshop
- VectorVest 7 EOD
- VectorVest 7 RealTime/IntraDay
- VectorVest AutoTester
- VectorVest Educational Services
- VectorVest OnLine
- VectorVest Options Analyzer
- VectorVest ProGraphics v6.0
- VectorVest ProTrader 7
- VectorVest RealTime Derby Tool
- VectorVest Simulator
- VectorVest Variator
- VectorVest Watchdog