HOT TOPICS LIST
- MACD
- Fibonacci
- RSI
- Gann
- ADXR
- Stochastics
- Volume
- Triangles
- Futures
- Cycles
- Volatility
- ZIGZAG
- MESA
- Retracement
- Aroon
INDICATORS LIST
LIST OF TOPICS
PRINT THIS ARTICLE
by Koos van der Merwe
Johnson Controls Inc. is a stock that should be on a watch list.
Position: Sell
Koos van der Merwe
Has been a technical analyst since 1969, and has worked as a futures and options trader with First Financial Futures in Johannesburg, South Africa.
PRINT THIS ARTICLE
ELLIOTT WAVE
Johnson Controls Inc.
12/26/13 03:43:56 PMby Koos van der Merwe
Johnson Controls Inc. is a stock that should be on a watch list.
Position: Sell
| The market is waiting... waiting to see whether the US Federal reserve will taper before Christmas, or wait until Janet Yellen takes over as Federal Reserve Chairman. Personally, I don't believe that Ben Bernanke will do anything to upset any plans that Janet Yellen has in mind, but the thought is always there that Janet could already be there...that anything Ben Bernanke may do is with her approval. So, looking for shares that you would like to hold knowing that "the taper" is on the cards — it is just a matter of when, is an exercise in itself. Johnson Controls Inc. (JCI) is a share that should be on your watch list. |

|
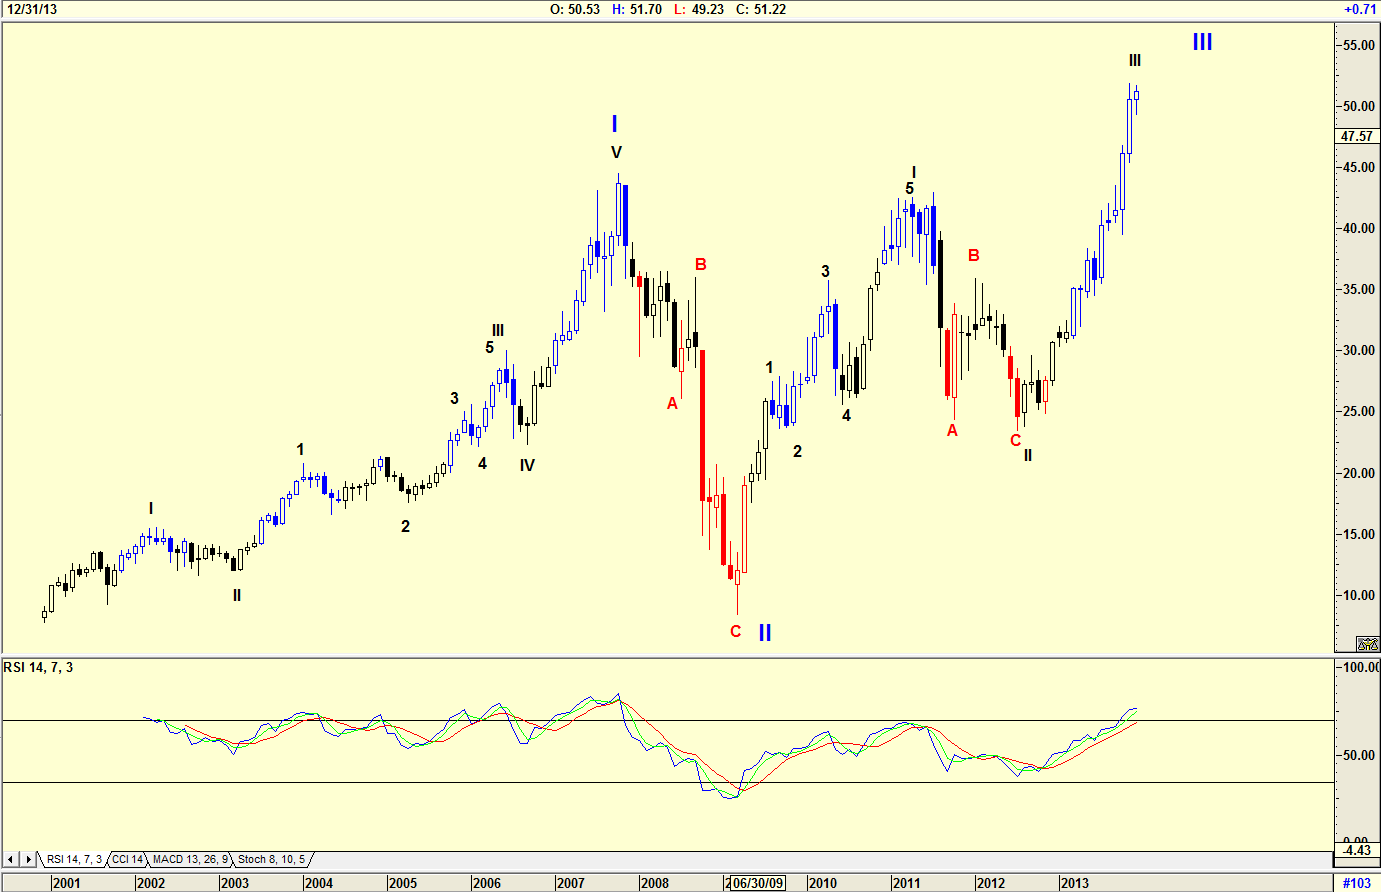
| Figure 1. Monthly chart of JCI with Elliot Wave count. |
| Graphic provided by: AdvancedGET. |
| |
| My chart in Figure 1 is a monthly chart with an Elliott Wave count suggesting that the share price could be completing a Wave III of a major WAVE III. The RSI indicator is at oversold levels suggesting that a sell signal could be given over the coming months. |

|
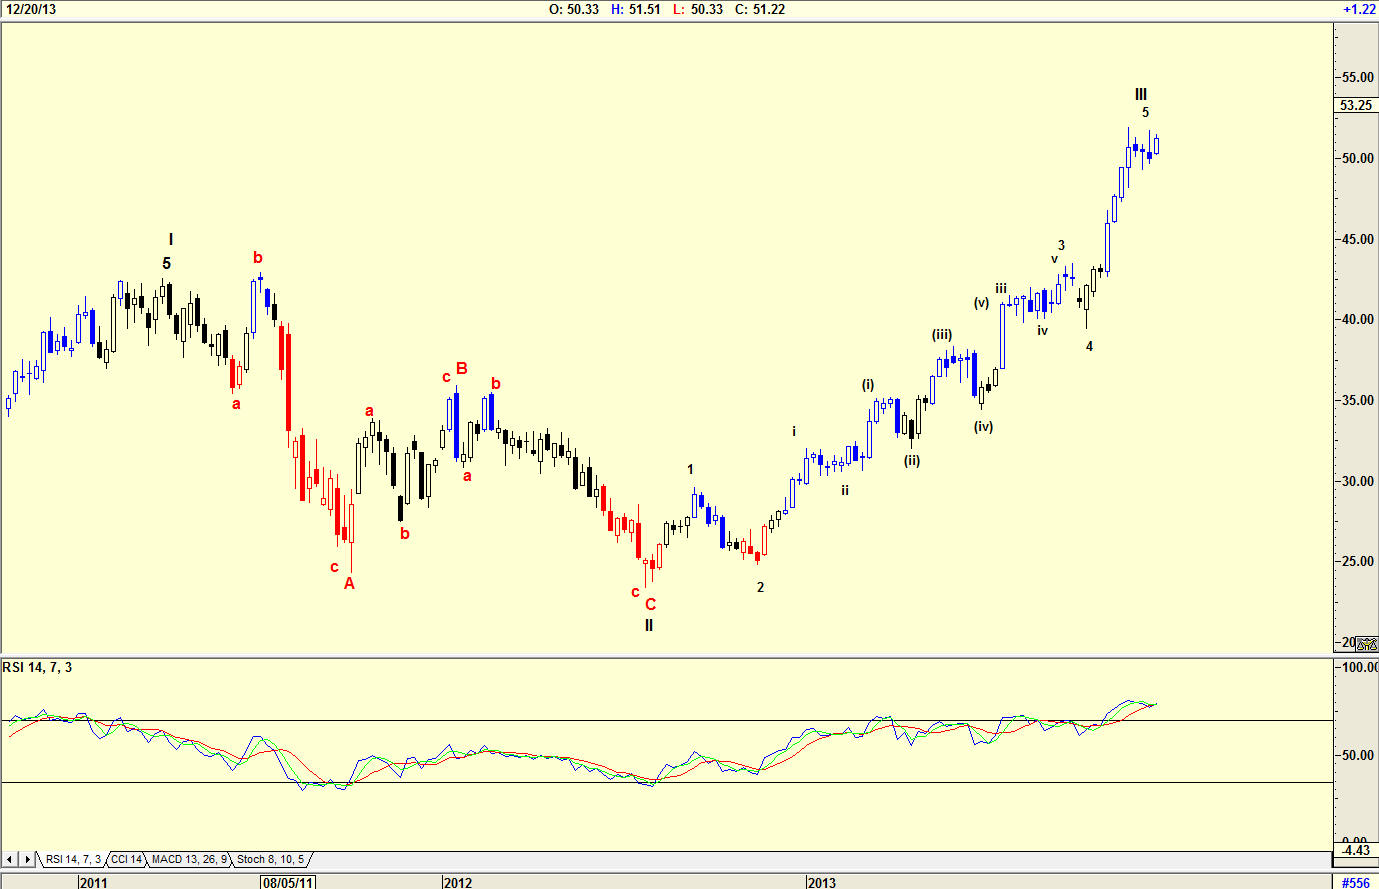
| Figure 2. Weekly chart of JCI showing RSI overbought levels. |
| Graphic provided by: AdvancedGET. |
| |
| The chart in Figure 2, a weekly chart, confirms that a Wave III top is forming. The chart suggests that a Wave 5 of Wave III is complete, and that an abc correction is now due. The RSI indicator is overbought, and could be suggesting a sell signal. |

|
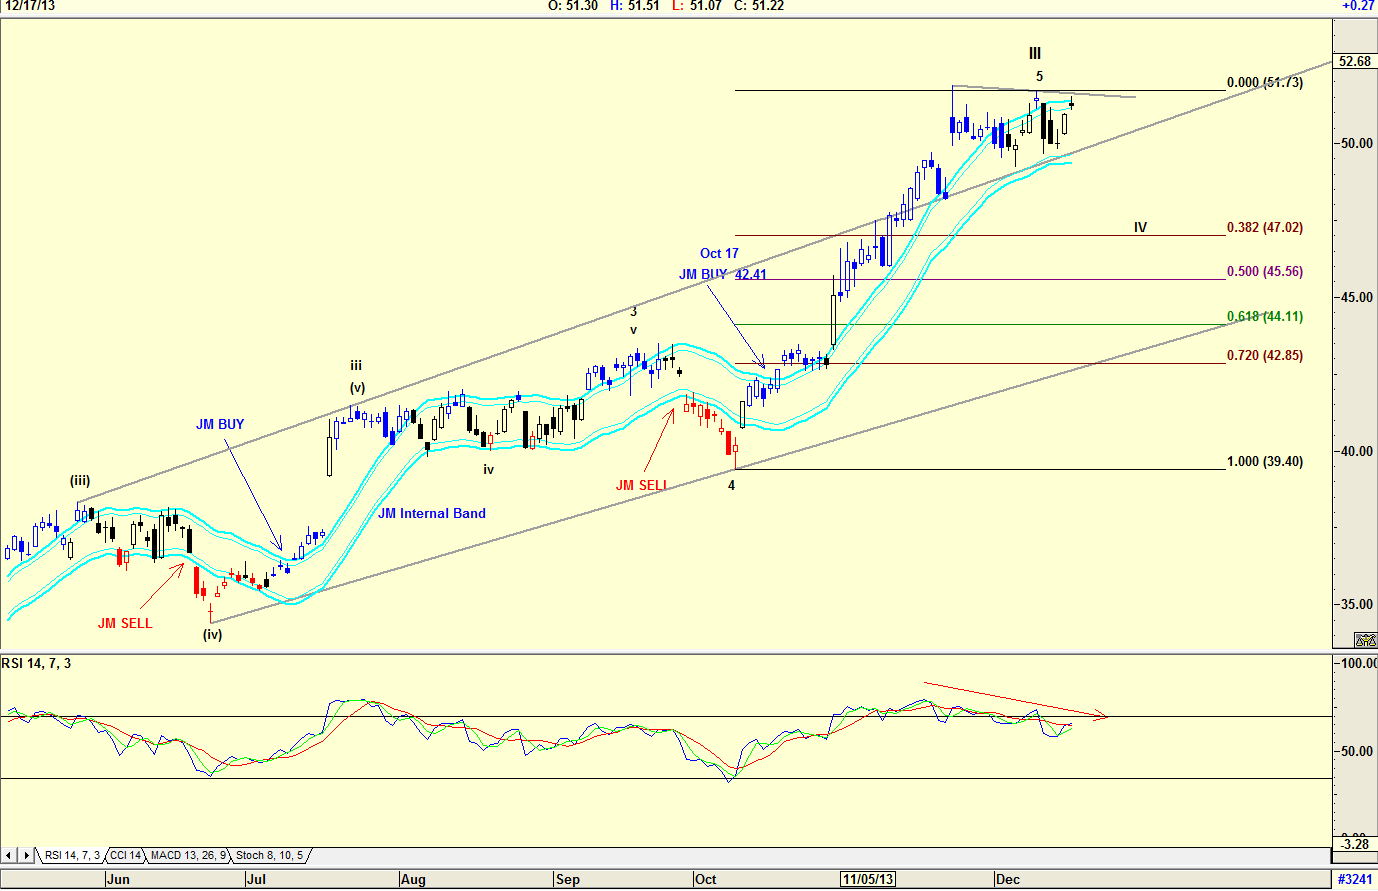
| Figure 3. Daily chart of JCI with JM Internal Band indicator. |
| Graphic provided by: AdvancedGET. |
| |
| The chart in Figure 3 is a daily chart with a JM Internal Band. The JM Internal Band is a 15-period simple moving average offset 2% positive and 2% negative. A buy signal was given on October 17th when the price was $42.41. The RSI indicator has given a sell signal, suggesting that the price could fall sometime in the future, with a Fibonacci retracement as shown on the chart suggesting $47.02, a 38.2% correction of Wave 5 of WAVE III. Of course it could correct to the 50% or 61.8% levels, but being optimistic I look at the smallest correction. Notice how the price broke above the upper resistance line and appears to be finding support on it. This does suggest strength, hence my gut feeling that the 38.2% retracement level could be it. I would not be a buyer of JCI at the moment, knowing that a WAVE IV correction should occur, but this is a share on my watch list to buy once that correction is complete. |
Has been a technical analyst since 1969, and has worked as a futures and options trader with First Financial Futures in Johannesburg, South Africa.
| Address: | 3256 West 24th Ave |
| Vancouver, BC | |
| Phone # for sales: | 6042634214 |
| E-mail address: | petroosp@gmail.com |
Click here for more information about our publications!
PRINT THIS ARTICLE

Request Information From Our Sponsors
- StockCharts.com, Inc.
- Candle Patterns
- Candlestick Charting Explained
- Intermarket Technical Analysis
- John Murphy on Chart Analysis
- John Murphy's Chart Pattern Recognition
- John Murphy's Market Message
- MurphyExplainsMarketAnalysis-Intermarket Analysis
- MurphyExplainsMarketAnalysis-Visual Analysis
- StockCharts.com
- Technical Analysis of the Financial Markets
- The Visual Investor
- VectorVest, Inc.
- Executive Premier Workshop
- One-Day Options Course
- OptionsPro
- Retirement Income Workshop
- Sure-Fire Trading Systems (VectorVest, Inc.)
- Trading as a Business Workshop
- VectorVest 7 EOD
- VectorVest 7 RealTime/IntraDay
- VectorVest AutoTester
- VectorVest Educational Services
- VectorVest OnLine
- VectorVest Options Analyzer
- VectorVest ProGraphics v6.0
- VectorVest ProTrader 7
- VectorVest RealTime Derby Tool
- VectorVest Simulator
- VectorVest Variator
- VectorVest Watchdog
