

HOT TOPICS LIST
- MACD
- Fibonacci
- RSI
- Gann
- ADXR
- Stochastics
- Volume
- Triangles
- Futures
- Cycles
- Volatility
- ZIGZAG
- MESA
- Retracement
- Aroon
INDICATORS LIST
LIST OF TOPICS
PRINT THIS ARTICLE
by Donald W. Pendergast, Jr.
Up by nearly 130% since July 2012, shares of Wynn Resorts Ltd. appear to be under distribution prior to a correction.
Position: N/A
Donald W. Pendergast, Jr.
Freelance financial markets writer and online publisher of the Trendzetterz.com S&P 500 Weekly Forecast service.
PRINT THIS ARTICLE
LINEAR REG CHANNEL
WYNN: Time To Lock In Gains To Avoid Loss?
12/18/13 11:22:24 AMby Donald W. Pendergast, Jr.
Up by nearly 130% since July 2012, shares of Wynn Resorts Ltd. appear to be under distribution prior to a correction.
Position: N/A
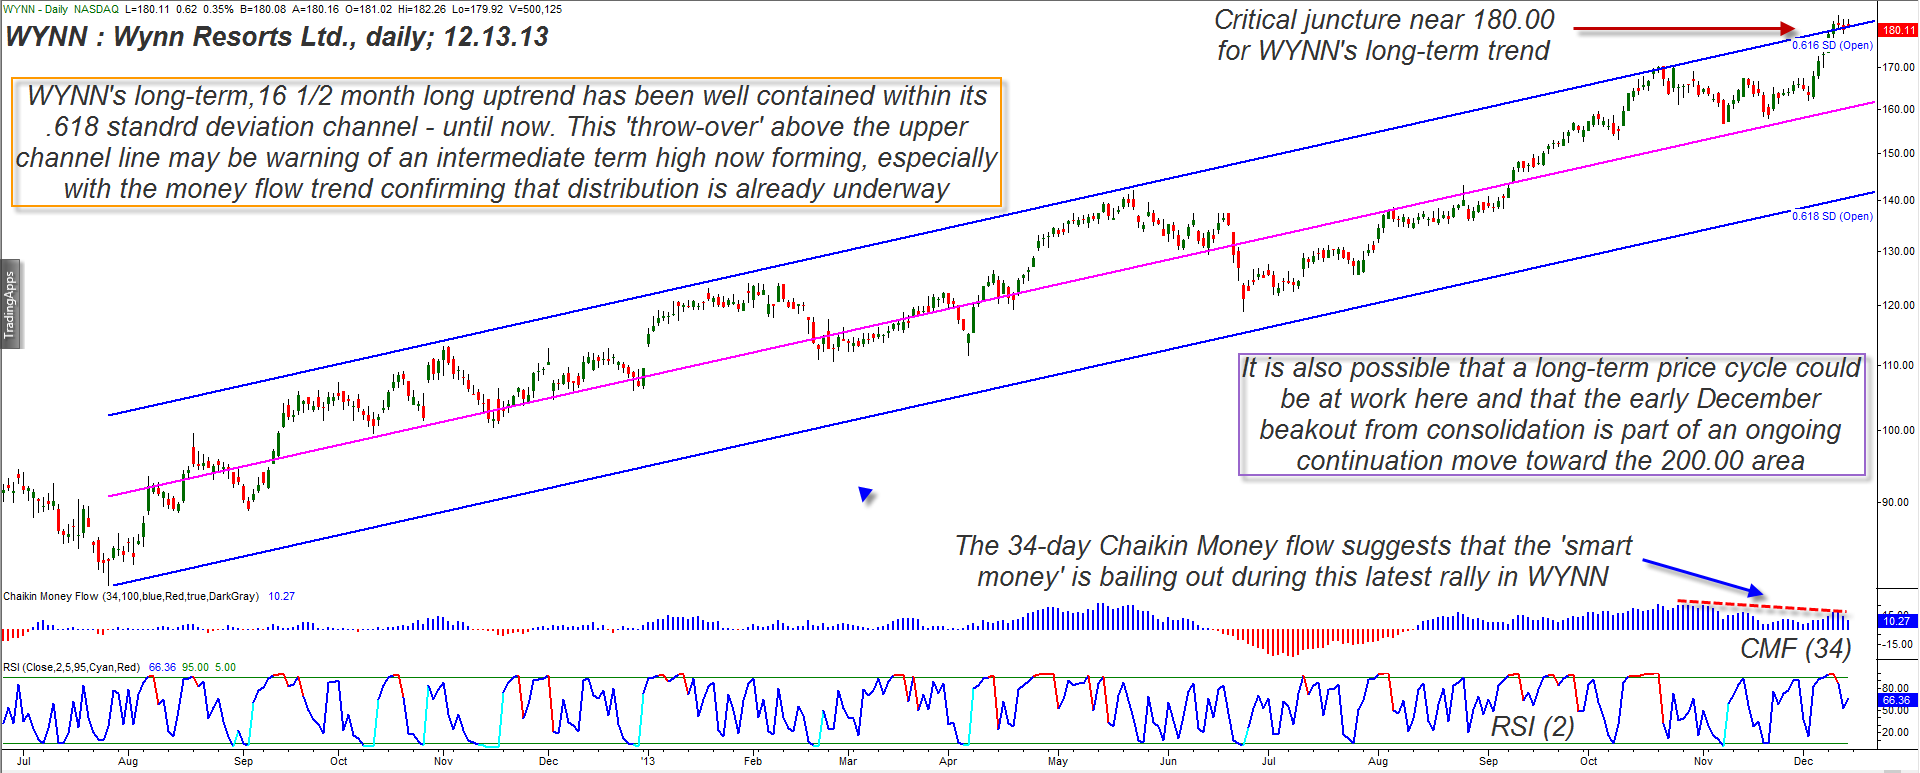
| Some stocks have a trending nature, others seem to have more of a cyclical tendency and still others alternate between the two modes in between a period of consolidation. Since the summer of 2012, shares of Wynn Resorts Ltd. (WYNN) have definitely been in the "trending" camp, as one look at its linear regression channel will demonstrate. Is WYNN's recent break above the upper channel line a sign of trend exhaustion or is it an indication that a major bullish continuation move is still underway? Here's a closer look (Figure 1). |
|
| Figure 1. WYNN's "throw-over" move above the upper regression channel line could be signaling the end of the stock's huge rally — or it could be hinting that a more substantial continuation move is underway. |
| Graphic provided by: TradeStation. |
| |
| WYNN's July 26, 2012 low of 79.61 was of the major, multicycle variety, the kind that often precedes major price moves; WYNN has so far managed to climb by 130% since coming up out of that low, all the while staying within a fairly narrow, modest volatility linear regression channel during its bullish run - until now. The channel — set at .618 standard deviations (SD) from the linear regression line — was just penetrated to the upside, and could be signaling one of two things: A. A "throw-over" move above a key resistance line after a trend has been long established may be a clue that the trend is exhausting itself, with late comers being the ones doing the bulk of the late stage buying rather than the "smart money." B. Conversely, the break above the top .618 SD channel may instead be confirming that WYNN still has some more room to run to the upside after the bullish continuation move that erupted on December 4, 2013. Obviously, the market itself, rather than a mere price chart, will determine the next significant move for WYNN in the days and weeks ahead. However, there are some things to consider here that may make the case for a correction more compelling than that for substantially higher prices heading into 2014, and these are as follows: 1. The major US stock indexes have all come close to or are already completing their Elliott 5th wave rallies and it's going to take a new round of willing buyers to push prices up from here. There are also enormous, bearish "butterfly" patterns in place on the weekly charts of the Dow 30 Industrials (.DJIA, DIA) and the S&P 500 (.SPX, SPY) indexes which also suggest that the next major move in the US stock indexes is a corrective one. 2. The money flow trend on WYNN's daily chart confirms that the "smart money" is not the big buyers undergirding WYNN's latest rally and push above the upper channel line at a time of clear distribution. This is a classic sign of an impending correction, especially since it has made its appearance at such a mature stage of the current bull run in the stock price. C. WYNN has missed its quarterly earning estimates twice in the past year (Dec. '12 and June '13) so its recent track record here is not as super-bullish as its chart might suggest, and that's something else to keep a watch out for. |
|
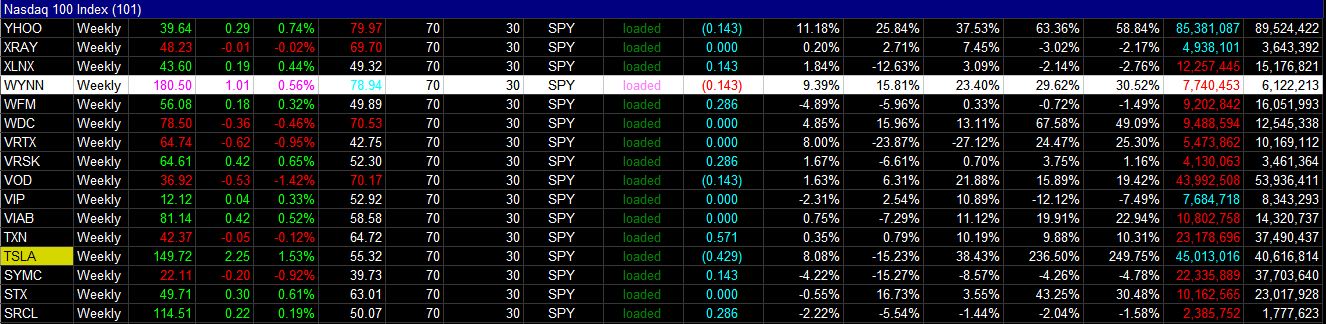
| Figure 2. WYNN has excellent comparative relative strength vs. the S&P 500 index (.SPX, SPY) over numerous time periods. |
| Graphic provided by: TradeStation. |
| Graphic provided by: TradeStation Radar Screen. |
| |
| Existing longs in WYNN should already have a trailing stop loss and/or exit strategy in place to protect open gains; speculative bears may want to consider shorting the stock if it drops back beneath the upper channel line in conjunction with a similar sell-off in the broad market indexes. The middle line of the channel (currently near 160.00) is the initial profit target, should such a setup appear within the next few trading sessions; a major trend reversal should have little trouble in seeing WYNN hit the 160.00 to 165.00 area in fairly quick fashion. Account risk for this short setup should be kept at 1% maximum and a two-to three bar trailing stop of the daily highs can be used as a guideline for trade management. Trade wisely until we meet here again. |
Freelance financial markets writer and online publisher of the Trendzetterz.com S&P 500 Weekly Forecast service.
| Title: | Market consultant and writer |
| Company: | Trendzetterz |
| Address: | 81 Hickory Hollow Drive |
| Crossville, TN 38555 | |
| Phone # for sales: | 904-303-4814 |
| Website: | trendzetterz.com |
| E-mail address: | support@trendzetterz.com |
Traders' Resource Links | |
| Trendzetterz has not added any product or service information to TRADERS' RESOURCE. | |
Click here for more information about our publications!
PRINT THIS ARTICLE

Request Information From Our Sponsors
- StockCharts.com, Inc.
- Candle Patterns
- Candlestick Charting Explained
- Intermarket Technical Analysis
- John Murphy on Chart Analysis
- John Murphy's Chart Pattern Recognition
- John Murphy's Market Message
- MurphyExplainsMarketAnalysis-Intermarket Analysis
- MurphyExplainsMarketAnalysis-Visual Analysis
- StockCharts.com
- Technical Analysis of the Financial Markets
- The Visual Investor
- VectorVest, Inc.
- Executive Premier Workshop
- One-Day Options Course
- OptionsPro
- Retirement Income Workshop
- Sure-Fire Trading Systems (VectorVest, Inc.)
- Trading as a Business Workshop
- VectorVest 7 EOD
- VectorVest 7 RealTime/IntraDay
- VectorVest AutoTester
- VectorVest Educational Services
- VectorVest OnLine
- VectorVest Options Analyzer
- VectorVest ProGraphics v6.0
- VectorVest ProTrader 7
- VectorVest RealTime Derby Tool
- VectorVest Simulator
- VectorVest Variator
- VectorVest Watchdog