

HOT TOPICS LIST
- MACD
- Fibonacci
- RSI
- Gann
- ADXR
- Stochastics
- Volume
- Triangles
- Futures
- Cycles
- Volatility
- ZIGZAG
- MESA
- Retracement
- Aroon
INDICATORS LIST
LIST OF TOPICS
PRINT THIS ARTICLE
by Chaitali Mohile
Meredith Corp. rallied to its 52-week high, consolidated, and went through a bearish breakout. Could a downtrend be developing?
Position: Sell
Chaitali Mohile
Active trader in the Indian stock markets since 2003 and a full-time writer. Trading is largely based upon technical analysis.
PRINT THIS ARTICLE
BREAKOUTS
Meredith Corporation: In A Bearish Trend?
12/18/13 03:39:06 PMby Chaitali Mohile
Meredith Corp. rallied to its 52-week high, consolidated, and went through a bearish breakout. Could a downtrend be developing?
Position: Sell
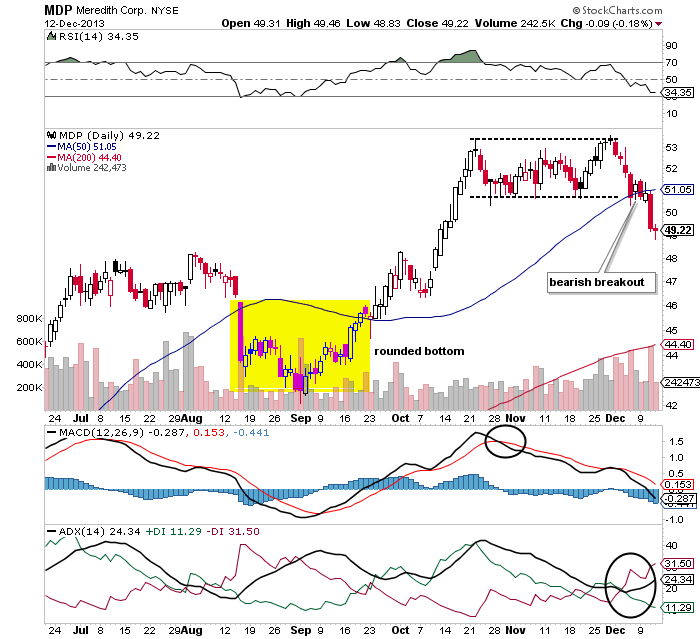
| After a rounded-bottom breakout rally, Meredith Corp (MDP) has been consolidating for over a month (Figure 1). The stock moved between $51 and $53. Think of a bullish consolidation as a time for the stock to pause until market participants decide to move it on some defined direction. As you can see from the chart in Figure 1, prices broke below the support of the consolidation range and the 50-day moving average (MA), which is an indication of a major trend reversal. Could this be the beginning of a bearish trend? |
|
| FIGURE 1: MDP, DAILY. The stock violated the lower trendline and the 50-day MA support. |
| Graphic provided by: StockCharts.com. |
| |
| The descending relative strength index (RSI)(14) has slipped below the 50 levels, indicating more downside for MDP. The moving average convergence/divergence (MACD)(12,26,9) underwent a bearish crossover during the consolidation phase of the price rally. Eventually, the momentum oscillator began declining toward the zero line in Figure 1. The average directional index (ADX)(14) is suggesting a developing downtrend. Hence, it is likely the bearish breakout will continue to increase the selling pressure on MDP. |
|
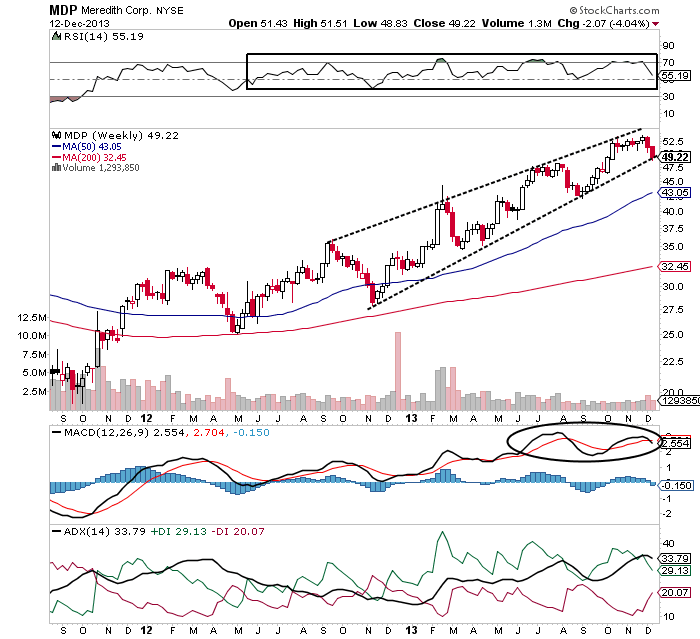
| FIGURE 2: MDP, WEEKLY. The narrow gap between the two converging trendline of the rising wedge suggests that the bearish breakout is underway. |
| Graphic provided by: StockCharts.com. |
| |
| A long-term bullish rally on the weekly time frame in Figure 2 has formed a rising wedge, which is a bearish reversal pattern. The RSI(14) has been moving between the 50 and 70 levels during the upward price action. The ADX(14) has reached high levels, and the tangled MACD line and trigger line indicate high volatility in the bullish rally. All these indicate a tapering of the bullish rally. |
| The rising wedge of MDP looks like it is ready to undergo a bearish breakout. However, traders should wait for the bearish signals from the indicators before initiating short positions. The 50-day MA is the major support for the potential bearish rally. Therefore, traders can consider this support as the target for their short positions. |
| Currently, all three indicators are at bullish levels. Therefore, the downward breakout of the rising wedge pattern should be confirmed by the bearish signs of the indicators. MDP has reached its 52-week highs so it is likely that price will go through a short-term bearish rally. |
Active trader in the Indian stock markets since 2003 and a full-time writer. Trading is largely based upon technical analysis.
| Company: | Independent |
| Address: | C1/3 Parth Indraprasth Towers. Vastrapur |
| Ahmedabad, Guj 380015 | |
| E-mail address: | chaitalimohile@yahoo.co.in |
Traders' Resource Links | |
| Independent has not added any product or service information to TRADERS' RESOURCE. | |
Click here for more information about our publications!
Comments

Request Information From Our Sponsors
- StockCharts.com, Inc.
- Candle Patterns
- Candlestick Charting Explained
- Intermarket Technical Analysis
- John Murphy on Chart Analysis
- John Murphy's Chart Pattern Recognition
- John Murphy's Market Message
- MurphyExplainsMarketAnalysis-Intermarket Analysis
- MurphyExplainsMarketAnalysis-Visual Analysis
- StockCharts.com
- Technical Analysis of the Financial Markets
- The Visual Investor
- VectorVest, Inc.
- Executive Premier Workshop
- One-Day Options Course
- OptionsPro
- Retirement Income Workshop
- Sure-Fire Trading Systems (VectorVest, Inc.)
- Trading as a Business Workshop
- VectorVest 7 EOD
- VectorVest 7 RealTime/IntraDay
- VectorVest AutoTester
- VectorVest Educational Services
- VectorVest OnLine
- VectorVest Options Analyzer
- VectorVest ProGraphics v6.0
- VectorVest ProTrader 7
- VectorVest RealTime Derby Tool
- VectorVest Simulator
- VectorVest Variator
- VectorVest Watchdog