

HOT TOPICS LIST
- MACD
- Fibonacci
- RSI
- Gann
- ADXR
- Stochastics
- Volume
- Triangles
- Futures
- Cycles
- Volatility
- ZIGZAG
- MESA
- Retracement
- Aroon
INDICATORS LIST
LIST OF TOPICS
PRINT THIS ARTICLE
by Billy Williams
Under Armour, Inc. (UA) fell on hard times, but if you approached bottom fishing from a trader's perspective you could have made out like a bandit.
Position: Buy
Billy Williams
Billy Williams has been trading the markets for 27 years, specializing in momentum trading with stocks and options.
PRINT THIS ARTICLE
Bottom Fishing The Right Way
12/16/13 04:11:24 PMby Billy Williams
Under Armour, Inc. (UA) fell on hard times, but if you approached bottom fishing from a trader's perspective you could have made out like a bandit.
Position: Buy
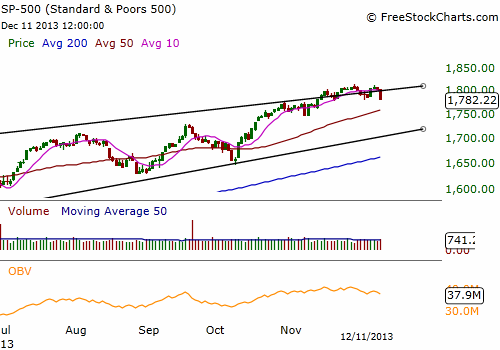
| The market seems to be struggling a bit as the year winds down which has a lot of traders worried whether the Grinch has stolen the Christmas rally this season. The market had traded above the upper trendline of an established channel pattern but has tucked back within the channel's range leaving many wondering whether it's time to sell and short the market. Traders that had been positively giddy over the latest bull run are getting nervous and ready for any signal to jump ship, lock in profits, and get out of the market altogether, but that would be a mistake. The market appears to be taking a pause, and if other stocks are acting weak, then there are even a greater number of stocks that show promise of strength with one stock in particular that is ready to rally. Under Armour, Inc. (UA) engages in the development, marketing, and distribution of branded performance apparel, footwear, and accessories for men, women, and youth throughout the world. The company's apparel line is famous and known for its fitted and loose types to be worn in hot, cold, and in between the extremes. It has a strong brand that has been painstakingly cultivated to attract a loyal following of full-time and weekend athletes that are attracted to its fashionable attire as well as its functional use in sports and fitness. |
|
| Figure 1. The S&P traded above the upper trendline of its price channel but has now pulled back slightly. It looks like the uptrend is pausing for now to make a run to higher ground as the year comes to a close. |
| Graphic provided by: www.freestockcharts.com. |
| |
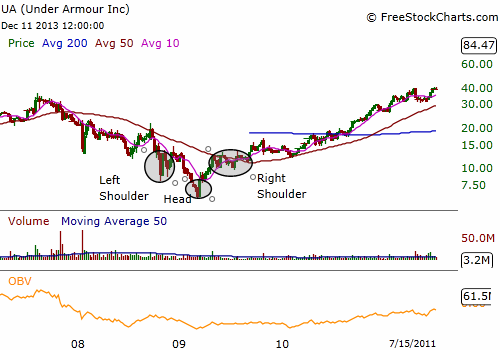
| The company's stock fell on hard times, literally, back in late 2007 as the overall market was showing stress fractures due to the impending housing crisis. It eventually fell from a previous high of $36.70 a share down to $5.97, losing over 80% of its value. Stocks that decline to such a massive degree lose favor with most investors and traders but can attract another type of speculator in droves: bottom fishers. Basically, bottom fishing is a quasi-value, contrarian strategy that looks to find stocks that are out of favor and offer a combination of being an extreme bargain pricing and the ability to recover. As a strategy, it has a certain appeal among value-oriented investors but the flaw in the strategy is that stocks that get taken down to those bargain levels can likely stay there a long time, and maybe permanently. |
|
| Figure 2. UA fell on hard times in leading up to the housing crisis. The stock lost 83% of its value from its price high to its price low causing most investors to flee the stock while attracting bottom fishers at the same time. For traders looking for bargain stocks, an inverted head & shoulders pattern formed signaling a price reversal was on its way. Using technical skills, traders could take a better position in the stock's recovery rather than just buying blindly like most bottom fishers. |
| Graphic provided by: www.freestockcharts.com. |
| |
| But, for traders, bottom fishing can be a lot more lucrative by combining it with a bit of technical skill. On the weekly chart, in the weeks leading up to October of 2008, UA was on a steady decline which could be spotted by the steady series of lower price highs and lower price lows. However, in October, the next leg down formed a left shoulder of an inverted head & shoulders pattern. The inverted head & shoulders pattern is a reversal price pattern that signals that a bottom may be forming. For traders looking to get in early to a UA stock recovery, this pattern revealed that a low-risk entry was shaping up. In March 2009, UA formed the head portion of the pattern and was followed by a rally combined with higher trade volume. A few months later, the right shoulder portion of the pattern formed followed by another rally where the neckline of the pattern was broken, confirming that a bottom was in place and that a rally could begin. |
|
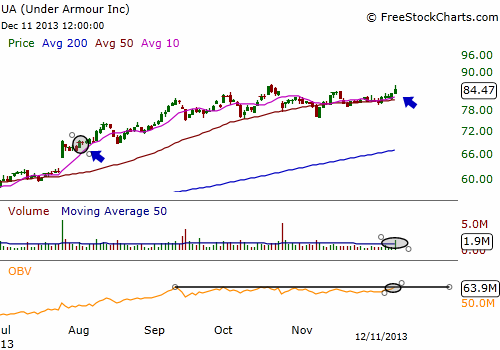
| Figure 3. The stock recovered from just under $6 to a current all-time high of $84.47 with signs that UA will go even higher. Along the way, UA offered several low-risk entries to build a position in the stock while offering a large degree of safety. Bottom fishing combined with a strong set of technical skills and price pattern recognition can give you a huge edge to make returns other investors/traders can only dream about. |
| Graphic provided by: www.freestockcharts.com. |
| |
| At this point, you would be looking for a low-risk setup to go long the stock and, possibly, to add to the position as the stock began making a steady series of higher highs and higher lows in its price action. Currently, UA has recovered from its low point and is trading at an all-time price high of $84.47 and has recently shown signs that it is likely to go higher. The big benefit for traders who develop a set of technical skills to spot price patterns and read price action is that you're not just jumping in and guessing as to when to take a position when bottom fishing a bargain stock. Instead, you wait for the stock to show signs of strength and reverse price movement before committing capital. This approach is the least risky approach and puts the odds on your side that you will emerge successful and, more importantly, profitable. |
Billy Williams has been trading the markets for 27 years, specializing in momentum trading with stocks and options.
| Company: | StockOptionSystem.com |
| E-mail address: | stockoptionsystem.com@gmail.com |
Traders' Resource Links | |
| StockOptionSystem.com has not added any product or service information to TRADERS' RESOURCE. | |
Click here for more information about our publications!
Comments

Request Information From Our Sponsors
- StockCharts.com, Inc.
- Candle Patterns
- Candlestick Charting Explained
- Intermarket Technical Analysis
- John Murphy on Chart Analysis
- John Murphy's Chart Pattern Recognition
- John Murphy's Market Message
- MurphyExplainsMarketAnalysis-Intermarket Analysis
- MurphyExplainsMarketAnalysis-Visual Analysis
- StockCharts.com
- Technical Analysis of the Financial Markets
- The Visual Investor
- VectorVest, Inc.
- Executive Premier Workshop
- One-Day Options Course
- OptionsPro
- Retirement Income Workshop
- Sure-Fire Trading Systems (VectorVest, Inc.)
- Trading as a Business Workshop
- VectorVest 7 EOD
- VectorVest 7 RealTime/IntraDay
- VectorVest AutoTester
- VectorVest Educational Services
- VectorVest OnLine
- VectorVest Options Analyzer
- VectorVest ProGraphics v6.0
- VectorVest ProTrader 7
- VectorVest RealTime Derby Tool
- VectorVest Simulator
- VectorVest Variator
- VectorVest Watchdog