HOT TOPICS LIST
- MACD
- Fibonacci
- RSI
- Gann
- ADXR
- Stochastics
- Volume
- Triangles
- Futures
- Cycles
- Volatility
- ZIGZAG
- MESA
- Retracement
- Aroon
INDICATORS LIST
LIST OF TOPICS
PRINT THIS ARTICLE
by Donald W. Pendergast, Jr.
After rallying nearly 80% in 13 months, shares of Nike, Inc. 'B' stock are beginning to reverse lower.
Position: N/A
Donald W. Pendergast, Jr.
Freelance financial markets writer and online publisher of the Trendzetterz.com S&P 500 Weekly Forecast service.
PRINT THIS ARTICLE
REVERSAL
NKE: Bearish Trend Reversal
12/13/13 03:47:32 PMby Donald W. Pendergast, Jr.
After rallying nearly 80% in 13 months, shares of Nike, Inc. 'B' stock are beginning to reverse lower.
Position: N/A
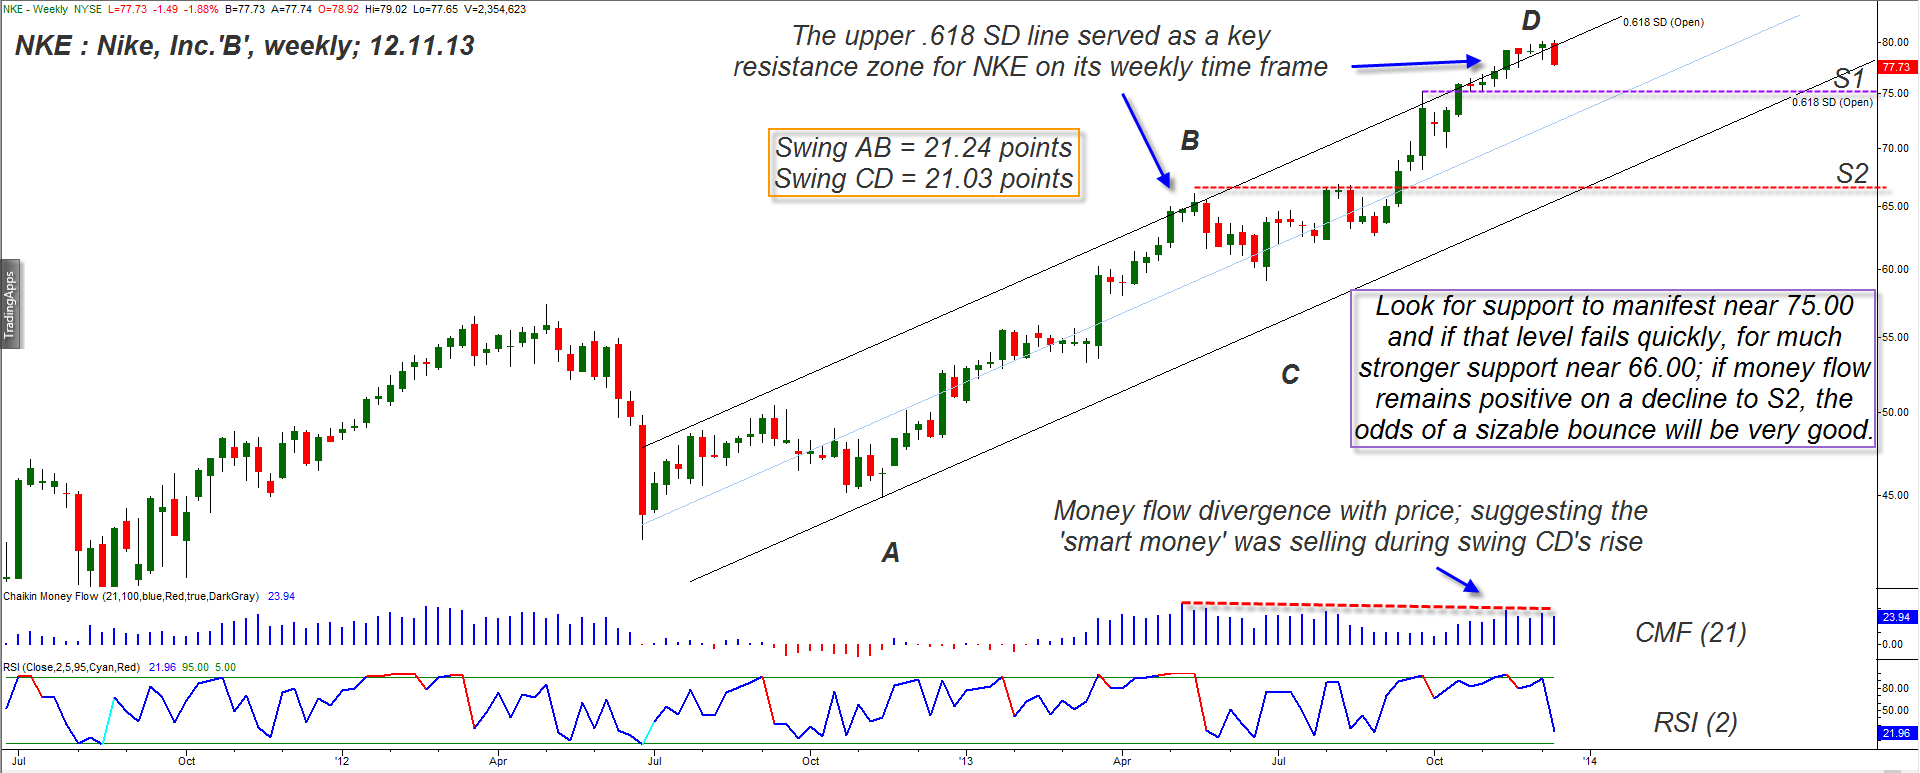
| The rally since mid-November 2013 in the major US stock indexes has been remarkable, and one of the best-performing Dow 30 Industrial (.DJIA, DIA) component stocks has been Nike Inc, 'B' (NKE); since that key market turn in late 2012, the shares managed to rise by 80% in a little less than 13 months, finally topping out at 80.26 on December 9, 2013. While the fundamentals for NKE still appear to be good over the long-term, at the moment the odds are high for the stock to make a proportional correction to key support areas in the near future. Here's a closer look, using NKE's weekly price chart (Figure 1). |

|
| Figure 1. Shares of Nike, Inc. 'B' (NKE) reverse lower after mildly exceeding its upper regression channel line at a time of weakening money flow. Swing AB and CD have nearly identical lengths. |
| Graphic provided by: TradeStation. |
| |
| Using weekly charts can often be useful when attempting to identify potential reversal areas in liquid stocks and ETFs, and as we examine this weekly chart of NKE that has just a couple of technical indicators, some major technical dynamics can be seen at work: 1. The linear regression channel (set at .618 standard deviations from the centerline) is revealing that NKE had recently collided with it and that the channel line is still a good predictor of where key support/resistance levels may be. 2. Swing AB is virtually the same length as swing CD; the first swing came in at 21.24 points and the latter at 21.03 points, with swing CD terminating close to the upper channel line. 3. The 21-week Chaikin Money flow histogram (CMF)(21) reveals that the "smart money" had been scaling out of their long positions during swing CD; this negative divergence with price action is known as "distribution" and is nearly always present before every meaningful bearish trend reversal in a given market. Taking all three dynamics as a whole, it was not surprising to see NKE reverse hard this week; though this week's price bar is only half complete as this is written, it still has been able to wipe out the gains of the previous three weeks and is getting close to taking out the previous four weeks of gains, too. This is definitely how most major trend reversals begin, and although there is no way to know how far NKE will ultimately decline before trending higher again, it's usually safe to anticipate support to manifest at the following places on the timeframe in question: 1. At Fibonacci retracement confluence zones. 2. At key moving averages (10-, 20-, 50- and 200-day moving averages). 3. At previous swing highs or lows. 4. At either end of wide-range price bars that also have above average trading volume. Two of those general support levels are depicted on the chart; S1 (near 75.00) coincides with prior support/resistance (S/R) area with high volumes and is also an area of various Fibonacci support confluences. S2 is formed by the same kind of technical dynamics and should be a formidable support level (near 66.00). As long as the money flow histogram remains above its zero line as each support level is tested, the probabilities of a tradable bullish bounce are above average. Whether or not a bounce from S1 or S2 will be enough to reignite the bullish fever in NKE is debatable, but such retracement levels should be more than strong enough to allow traders using 30-to 60-minute charts to time a variety of long trade entries. |

|
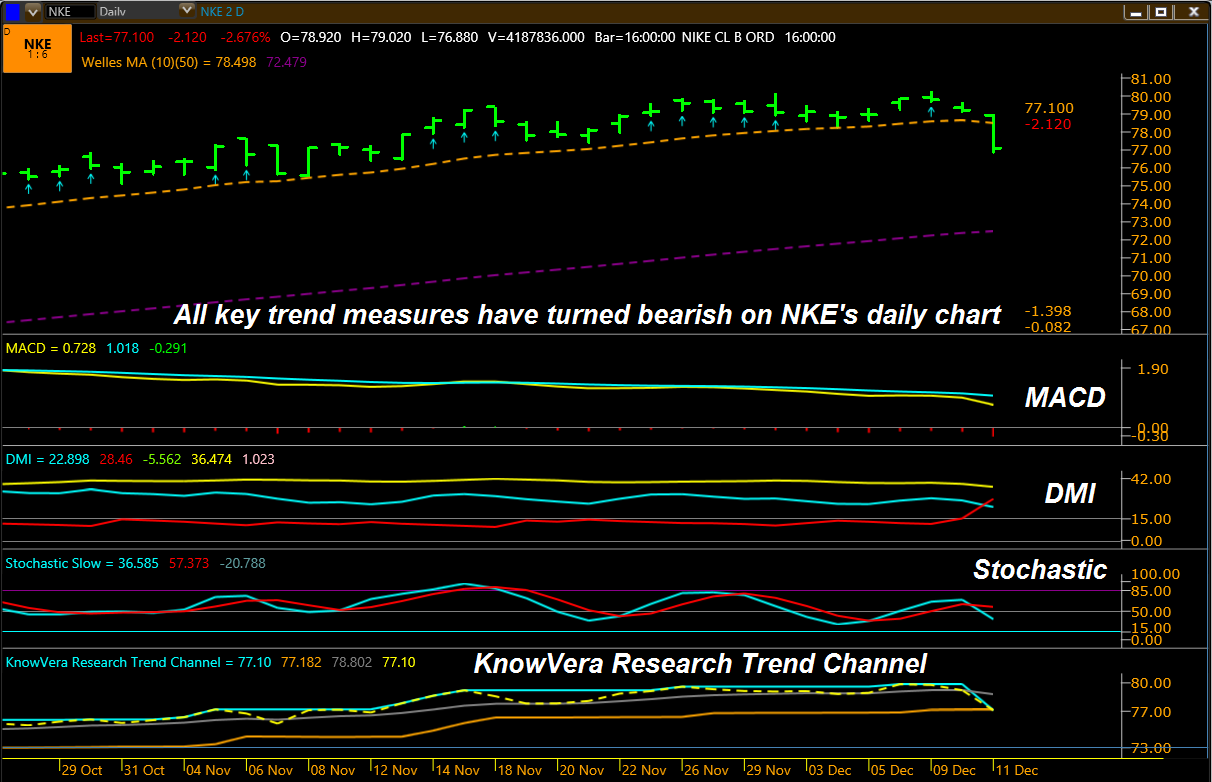
| Figure 2. NKE's daily chart shows the bearish reversal in finer detail; the stock's next meaningful support area is near 75.00. |
| Graphic provided by: Phantom Trader by KnowVere Research LLC. |
| |
| NKE's daily chart in Figure 2 also confirms a strong bearish reversal underway; the MACD, DMI, stochastic and KnowVera Trend Channel have all turned bearish as of December 11, 2013; traders who have access to intraday charts may want to wait for a minor pullback to the 10-period moving average on the 60-minute chart to help time a retracement short swing trade entry in NKE. Once in such a short trade, consider using a three-bar trailing stop based on the daily highs for the stock until final stop out, being aware of the support level near 75.00 that may be a wise area to take half profits. If a larger-scale downdraft develops, you'd still have on half a position should NKE be inclined to move sharply lower toward S2 as we head into 2014. Trade risk should be limited to a maximum of 2% of your account equity, regardless of how bearish you may be on NKE at the moment. Trade wisely until we meet here again. |
Freelance financial markets writer and online publisher of the Trendzetterz.com S&P 500 Weekly Forecast service.
| Title: | Market consultant and writer |
| Company: | Trendzetterz |
| Address: | 81 Hickory Hollow Drive |
| Crossville, TN 38555 | |
| Phone # for sales: | 904-303-4814 |
| Website: | trendzetterz.com |
| E-mail address: | support@trendzetterz.com |
Traders' Resource Links | |
| Trendzetterz has not added any product or service information to TRADERS' RESOURCE. | |
Click here for more information about our publications!
PRINT THIS ARTICLE

Request Information From Our Sponsors
- VectorVest, Inc.
- Executive Premier Workshop
- One-Day Options Course
- OptionsPro
- Retirement Income Workshop
- Sure-Fire Trading Systems (VectorVest, Inc.)
- Trading as a Business Workshop
- VectorVest 7 EOD
- VectorVest 7 RealTime/IntraDay
- VectorVest AutoTester
- VectorVest Educational Services
- VectorVest OnLine
- VectorVest Options Analyzer
- VectorVest ProGraphics v6.0
- VectorVest ProTrader 7
- VectorVest RealTime Derby Tool
- VectorVest Simulator
- VectorVest Variator
- VectorVest Watchdog
- StockCharts.com, Inc.
- Candle Patterns
- Candlestick Charting Explained
- Intermarket Technical Analysis
- John Murphy on Chart Analysis
- John Murphy's Chart Pattern Recognition
- John Murphy's Market Message
- MurphyExplainsMarketAnalysis-Intermarket Analysis
- MurphyExplainsMarketAnalysis-Visual Analysis
- StockCharts.com
- Technical Analysis of the Financial Markets
- The Visual Investor
