

HOT TOPICS LIST
- MACD
- Fibonacci
- RSI
- Gann
- ADXR
- Stochastics
- Volume
- Triangles
- Futures
- Cycles
- Volatility
- ZIGZAG
- MESA
- Retracement
- Aroon
INDICATORS LIST
LIST OF TOPICS
PRINT THIS ARTICLE
by Matt Blackman
Most traders are familiar with double and triple tops, head and shoulder tops and a host of other topping patterns, but a Prussian Helmet? What is it and how does it work?
Position: N/A
Matt Blackman
Matt Blackman is a full-time technical and financial writer and trader. He produces corporate and financial newsletters, and assists clients in getting published in the mainstream media. He is the host of TradeSystemGuru.com. Matt has earned the Chartered Market Technician (CMT) designation. Find out what stocks and futures Matt is watching on Twitter at www.twitter.com/RatioTrade
PRINT THIS ARTICLE
CHART ANALYSIS
The Prussian Helmet
12/11/13 01:01:42 PMby Matt Blackman
Most traders are familiar with double and triple tops, head and shoulder tops and a host of other topping patterns, but a Prussian Helmet? What is it and how does it work?
Position: N/A
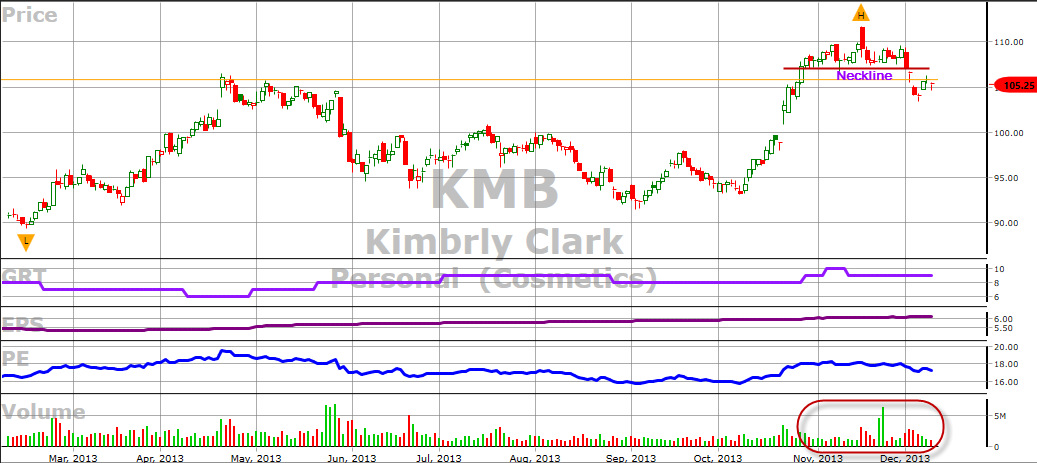
| In a recent Twitter post, Michael Kahn, author of the Barron's Getting Technical column, referenced a pattern he was seeing on Kimberly Clark (KMB) called the Prussian Helmet. Kahn described it as a squashed head & shoulders-like pattern with a spike failure as the head. Intrigued, I began to do some research. |
| The earliest reference I found came via a post on AussieStockForums.com in which the poster referenced James Dines' 1972 book, "How the Average Investor Can Use Technical Analysis for Stock Profits: An In-Depth Work on Stock Market Technical Analysis, Mob Psychology, and Fundamentals." It included the following quotes by Dines; "There are only four simple tops: Tombstone, Saucer, V-Top, and Prussian Helmet... The Prussian Helmet is usually found after spectacular advances into exceedingly overpriced territory, so the stock cannot stay up there for long." The book was chosen by Stock Trader's Almanac as the investment book of the year in 1974. |
| As we see in Figure 1, KMB puts in a new high in mid-November 2013 in spectacular fashion but then the rally fails, followed by a decisive breach in the neckline on December 2 to confirm the Prussian Helmet pattern — named for the protective head gear adorned with a single menacing vertical metal spike worn by Prussian (German) troops in the 19th and early 20th centuries. |
|
| Figure 1. Daily chart showing the Prussian Helmet formation on Kimberly Clark Corp in October/November with a neckline breach on December 2, 2013. Note the volume pattern in the lower subgraph with a spike in buying volume immediately after the spike (H) followed by the buying failure. |
| Graphic provided by: www.VectorVest.com. |
| |
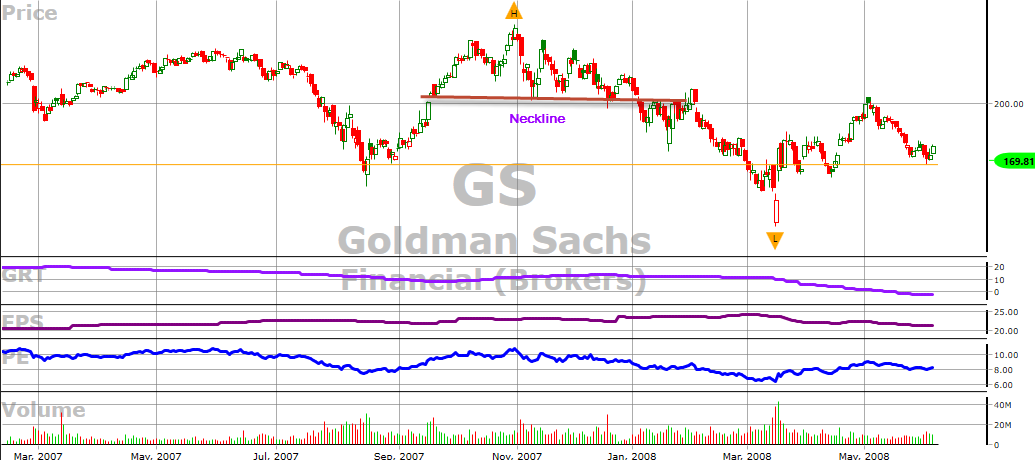
| After scanning a raft of stock charts at previous tops, I discovered why the chart pattern was rarely mentioned in the trading literature and not even referenced in Tom Bulkowski's essential tome "Encyclopedia of Charts Patterns" (Wiley 2005). It was a relatively rare pattern and for someone like Bulkowski who rigorously explores the success and failure rates of chart patterns, there simply isn't enough data for conclusive statistical analysis. But that doesn't mean that the pattern is not valuable. As we see in Figure 2 showing Goldman Sachs in late 2007, the pattern marked the stocks rally high and the beginning of the correction which would eventually compress the stock price by 75%. |
|
| Figure 2. Daily chart of Goldman Sachs showing the Prussian Helmet-like pattern and subsequent correction which marked the peak of the rally in 2007. |
| Graphic provided by: www.VectorVest.com. |
| |
| Whether or not the December 2013 Prussian Helmet will prove to be an overpriced and unsustainable top for Kimberly Clark remains to be seen. But it is certainly worth following. I challenge you to keep an eye open for this elusive pattern. Given the big moves stocks have made from the bottom in 2007, there are a growing number of signs that a top is approaching and the Prussian Helmet in one or more of your portfolio holdings could very well furnish you with a prescient exit signal. |
Matt Blackman is a full-time technical and financial writer and trader. He produces corporate and financial newsletters, and assists clients in getting published in the mainstream media. He is the host of TradeSystemGuru.com. Matt has earned the Chartered Market Technician (CMT) designation. Find out what stocks and futures Matt is watching on Twitter at www.twitter.com/RatioTrade
| Company: | TradeSystemGuru.com |
| Address: | Box 2589 |
| Garibaldi Highlands, BC Canada | |
| Phone # for sales: | 604-898-9069 |
| Fax: | 604-898-9069 |
| Website: | www.tradesystemguru.com |
| E-mail address: | indextradermb@gmail.com |
Traders' Resource Links | |
| TradeSystemGuru.com has not added any product or service information to TRADERS' RESOURCE. | |
Click here for more information about our publications!
Comments

Request Information From Our Sponsors
- VectorVest, Inc.
- Executive Premier Workshop
- One-Day Options Course
- OptionsPro
- Retirement Income Workshop
- Sure-Fire Trading Systems (VectorVest, Inc.)
- Trading as a Business Workshop
- VectorVest 7 EOD
- VectorVest 7 RealTime/IntraDay
- VectorVest AutoTester
- VectorVest Educational Services
- VectorVest OnLine
- VectorVest Options Analyzer
- VectorVest ProGraphics v6.0
- VectorVest ProTrader 7
- VectorVest RealTime Derby Tool
- VectorVest Simulator
- VectorVest Variator
- VectorVest Watchdog
- StockCharts.com, Inc.
- Candle Patterns
- Candlestick Charting Explained
- Intermarket Technical Analysis
- John Murphy on Chart Analysis
- John Murphy's Chart Pattern Recognition
- John Murphy's Market Message
- MurphyExplainsMarketAnalysis-Intermarket Analysis
- MurphyExplainsMarketAnalysis-Visual Analysis
- StockCharts.com
- Technical Analysis of the Financial Markets
- The Visual Investor