HOT TOPICS LIST
- MACD
- Fibonacci
- RSI
- Gann
- ADXR
- Stochastics
- Volume
- Triangles
- Futures
- Cycles
- Volatility
- ZIGZAG
- MESA
- Retracement
- Aroon
INDICATORS LIST
LIST OF TOPICS
PRINT THIS ARTICLE
by Donald W. Pendergast, Jr.
Shares of Priceline.com may be close to reaching their ultimate high of a well-defined Elliott Wave pattern.
Position: N/A
Donald W. Pendergast, Jr.
Freelance financial markets writer and online publisher of the Trendzetterz.com S&P 500 Weekly Forecast service.
PRINT THIS ARTICLE
ELLIOTT WAVE
Priceline.com: Five-Wave Pattern Near Completion
12/12/13 03:34:45 PMby Donald W. Pendergast, Jr.
Shares of Priceline.com may be close to reaching their ultimate high of a well-defined Elliott Wave pattern.
Position: N/A
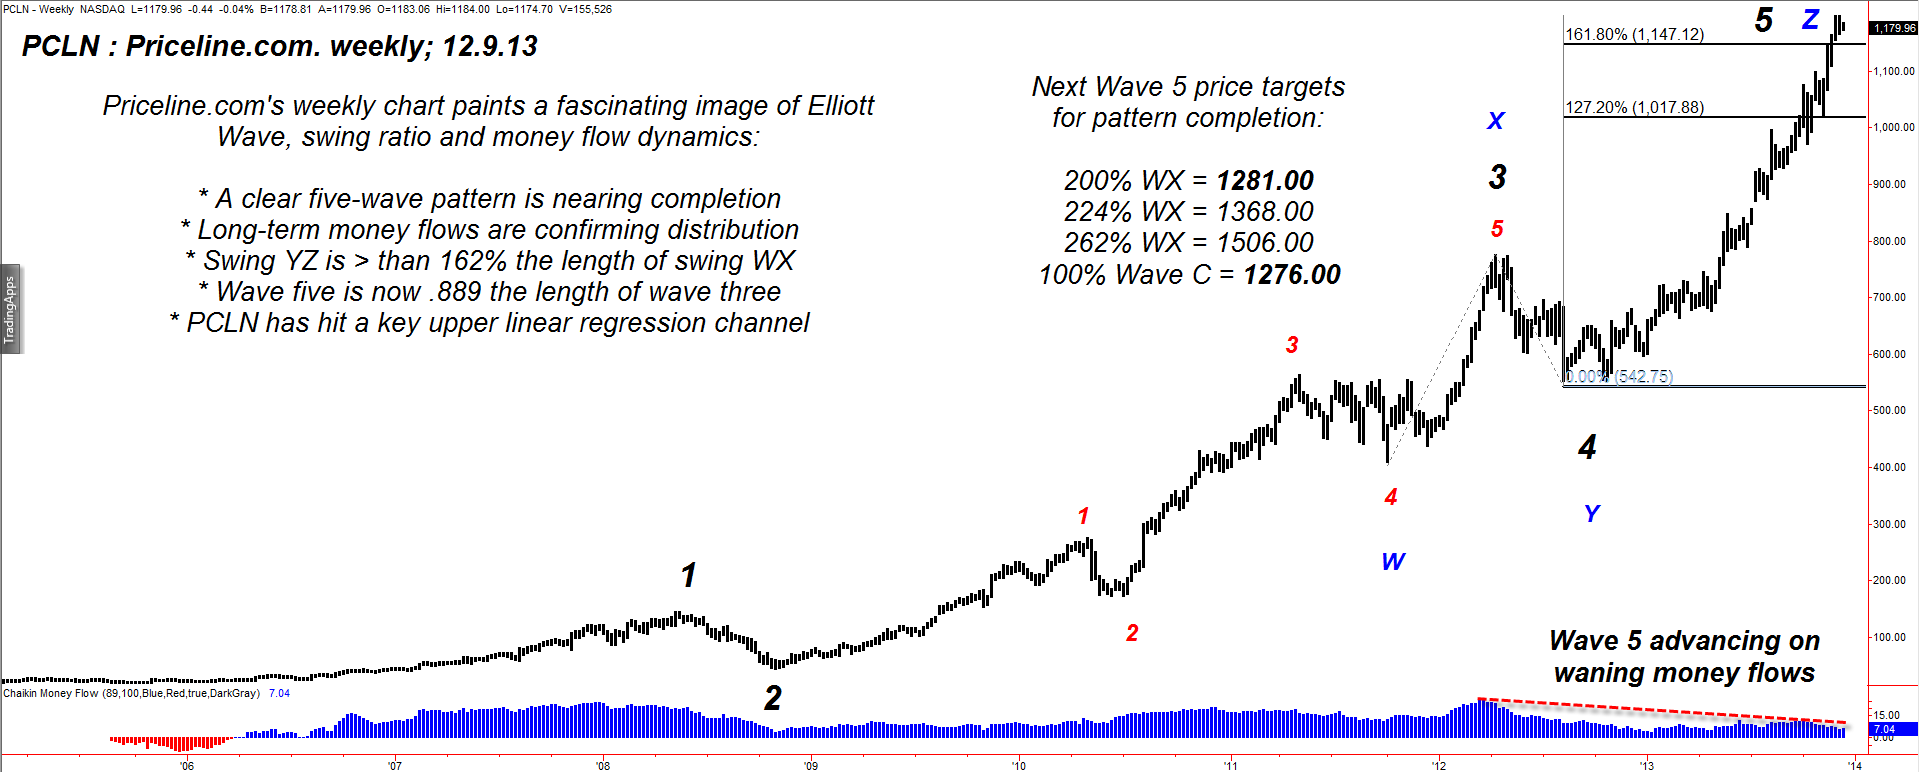
| Priceline.com's (PCLN) share price was decimated during the 2000 dotcom implosion, finally cratering at a bargain-basement low of $6.30 per share in October 2002. It's remarkable that the company even survived the 2000-2002 stock market crash, given the high failure rate of many other Internet-craze darling stocks that were so hyped by Wall Street during the 1994-2000 frenzy era. But a survivor it was, and over time its business model proved it had what it took to compete, to thrive, and to outperform most of its industry group peers by a wide margin. But now, after an 84% gain so far in 2013, PCLN may be at or very near a 'major high' as a key five-wave Elliott pattern completes. Here's a closer look. |

|
| Figure 1. Captain Kirk must surely be enjoying Priceline.com's (PCLN) trip up into the stars, but hopefully he is aware that the Klingons in the market may wish to abort its attempt to expand ever higher into new price zone galaxies, where few stocks have ever ventured before. PCLN's five-wave Elliott pattern voyage is nearing completion. |
| Graphic provided by: TradeStation. |
| |
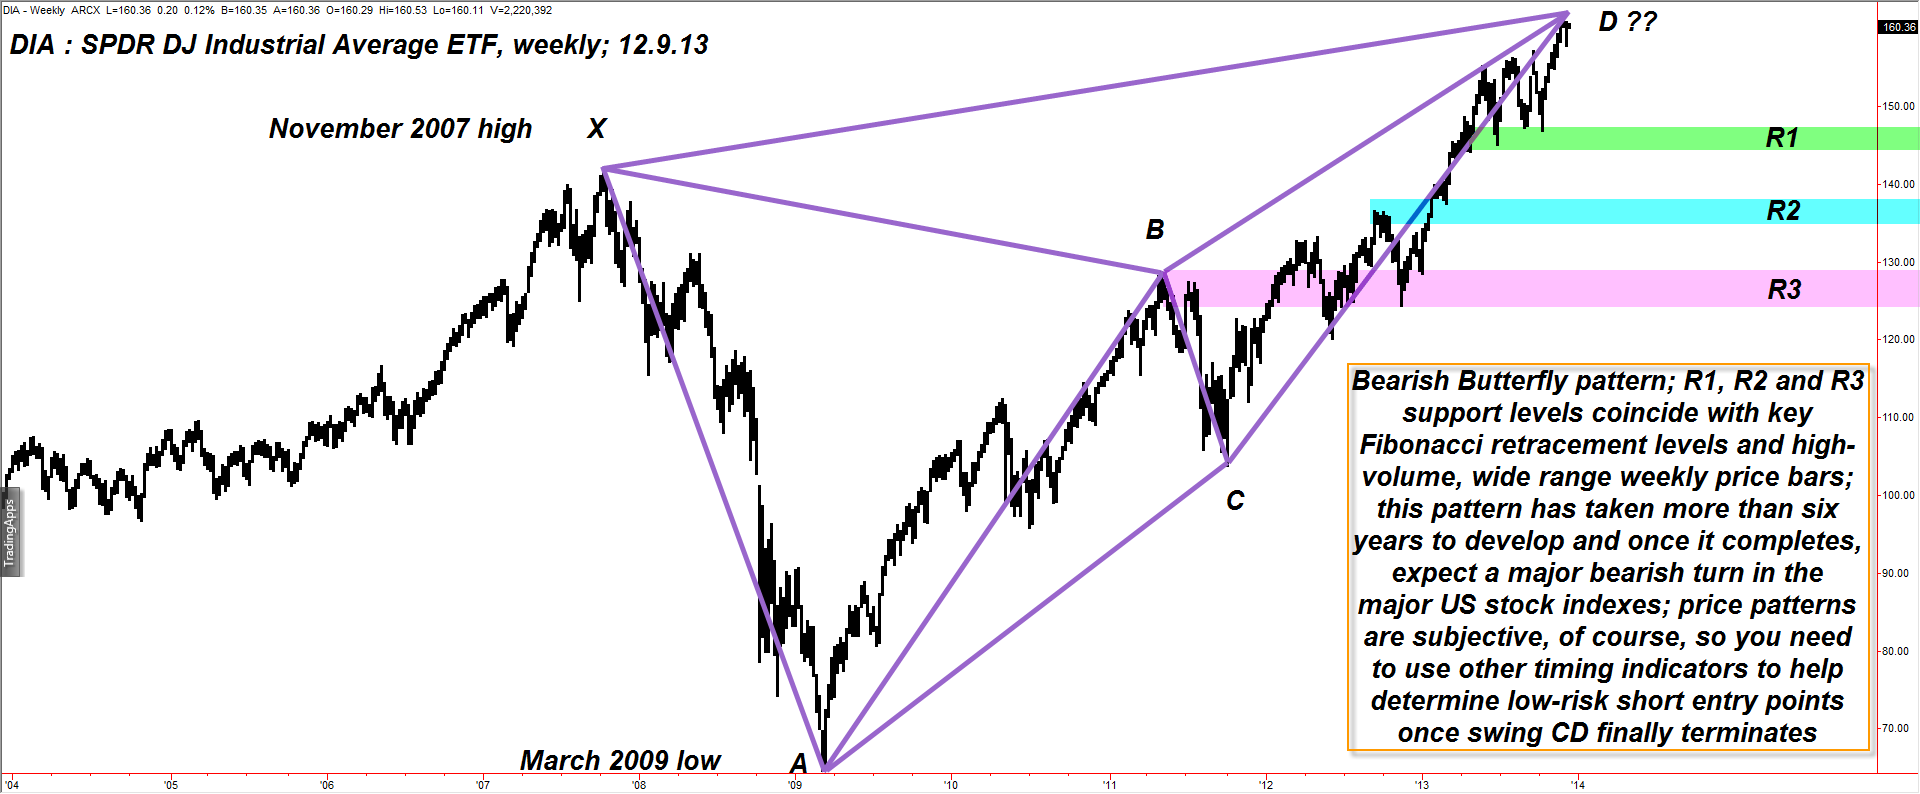
| Using the weekly chart of PCLN such as the one in Figure 1, we can get a nice view of the major trend dynamics at work in this stock; notice the large-scale, five wave Elliott wave pattern in play, one that is at or near a price target completion zone, based on a number of factors: 1. The fifth wave advance has been achieved on declining long-term money flows, suggesting that the "smart money" has been using this latest rally (since November 2012) to sell out of their long-held positions in this big winner. 2. Swing YZ has now exceeded 162% of the length of swing WX; Fibonacci extension ratios like these are not "magic numbers" but they do a good job of forecasting likely swing termination moves. 3. Wave 5 is now .889 the length of wave 3 (that's a minor Fib ratio). 4. PCLN recently hit its 233-day upper standard deviation channel line and has yet to recover after declining slightly. Bear in mind that these dynamics in PCLN are occurring at a time when the S&P 500 index (.SPX, SPY) is also nearing its own Elliott five wave pattern completion target and a major bearish butterfly pattern on its weekly time frame as well. Any rally past 182.00 in SPY should alert traders and investors that the line of least resistance in SPY is back down to at least the Fibonacci 24% retracement of swing CD: R1 = 163.05 to 164.31 (Fib 24% area support) R2 = 153.38 to 155.73 (Fib 38% area support) R3 = 144.55 to 148.11 (Fib 50% area support) The Dow 30 Industrials is also depicting a bearish butterfly pattern on its weekly time frame (Figure 2); the pattern is close to a termination of swing CD. A bearish reversal will likely find support near R1, which is near the 144.00 to 148.00 level. R2 offers support between the 136.00 to 138.00 level and R3 should offer support between the 124.00 to 129.00 level. These are general guidelines and there is no way to know beforehand if any or all of these support zones will be reached any time soon. R1, obviously, has the highest probability of being reached in early 2014 if swing CD terminates within the next few weeks. |

|
| Figure 2. The mighty Dow 30 Industrials (.DJIA, DIA) is also at or near a key pattern completion zone; this bearish Butterfly pattern suggests that the Dow's next big move is likely to be toward lower price levels in 2014. |
| Graphic provided by: TradeStation. |
| |
| Okay, now that you have seen some visual evidence that some sort of a major high is about to be (or maybe already has been) reached in PCLN, SPY and DIA, what next? How might a trader go about getting positioned to profit from a bearish reversal? Look for key reversal candle patterns on the 60-minute and daily charts for each of these three instruments; when a breakdown below the pattern commences on the 60-minute chart, go short with half of your position. Once the same pattern and breakdown appears on the daily time frame, put on the second half of your position. Your price targets are the Fibonacci 24% and 38% retracements of the larger-scale swing CD on the DIA and SPY and for PCLN you're looking for an initial price target near the 1025.00 to 1050.00 area. Use a suitable trailing stop for each short position, perhaps a nine to 13-day simple moving average or even a five to seven-bar price channel. These are reversal patterns — but of a major degree — so it's up to you if you want to risk 1% or get more aggressive and risk a full 2% of your account value on these Elliott and butterfly patterns. |
| Expect to see major bearish reversals in all key sectors of the US stock market heading into 2014; stay abreast of the most attractive shorting opportunities by scanning for five-wave Elliott pattern completions and for bearish butterfly patterns and you'll probably find it to be time well-spent. |
Freelance financial markets writer and online publisher of the Trendzetterz.com S&P 500 Weekly Forecast service.
| Title: | Market consultant and writer |
| Company: | Trendzetterz |
| Address: | 81 Hickory Hollow Drive |
| Crossville, TN 38555 | |
| Phone # for sales: | 904-303-4814 |
| Website: | trendzetterz.com |
| E-mail address: | support@trendzetterz.com |
Traders' Resource Links | |
| Trendzetterz has not added any product or service information to TRADERS' RESOURCE. | |
Click here for more information about our publications!
PRINT THIS ARTICLE

Request Information From Our Sponsors
- VectorVest, Inc.
- Executive Premier Workshop
- One-Day Options Course
- OptionsPro
- Retirement Income Workshop
- Sure-Fire Trading Systems (VectorVest, Inc.)
- Trading as a Business Workshop
- VectorVest 7 EOD
- VectorVest 7 RealTime/IntraDay
- VectorVest AutoTester
- VectorVest Educational Services
- VectorVest OnLine
- VectorVest Options Analyzer
- VectorVest ProGraphics v6.0
- VectorVest ProTrader 7
- VectorVest RealTime Derby Tool
- VectorVest Simulator
- VectorVest Variator
- VectorVest Watchdog
- StockCharts.com, Inc.
- Candle Patterns
- Candlestick Charting Explained
- Intermarket Technical Analysis
- John Murphy on Chart Analysis
- John Murphy's Chart Pattern Recognition
- John Murphy's Market Message
- MurphyExplainsMarketAnalysis-Intermarket Analysis
- MurphyExplainsMarketAnalysis-Visual Analysis
- StockCharts.com
- Technical Analysis of the Financial Markets
- The Visual Investor
