HOT TOPICS LIST
- MACD
- Fibonacci
- RSI
- Gann
- ADXR
- Stochastics
- Volume
- Triangles
- Futures
- Cycles
- Volatility
- ZIGZAG
- MESA
- Retracement
- Aroon
INDICATORS LIST
LIST OF TOPICS
PRINT THIS ARTICLE
by Koos van der Merwe
Dividends do not only provide income for shareholders. Strong dividend growth can be a powerful signal about fundamental health and management confidence in the future of a business.
Position: Sell
Koos van der Merwe
Has been a technical analyst since 1969, and has worked as a futures and options trader with First Financial Futures in Johannesburg, South Africa.
PRINT THIS ARTICLE
RSI
CVS Caremark Corp.
12/11/13 12:54:14 PMby Koos van der Merwe
Dividends do not only provide income for shareholders. Strong dividend growth can be a powerful signal about fundamental health and management confidence in the future of a business.
Position: Sell
| A business that delivers big dividend increases for investors, usually has the quality and financial soundness to continue raising distributions for years to come. This simple fact makes each of these companies worth a closer look by investors looking to supercharge their portfolios. CVS is one of the largest U.S. pharmacy retailers and also a leading pharmacy benefit manager. The company is a major beneficiary from growing health care demand. CVS has consecutively increased dividends over the last ten years. It present yield is 1.35%, not that wonderful, but its share price growth since 2003 is excellent. |

|
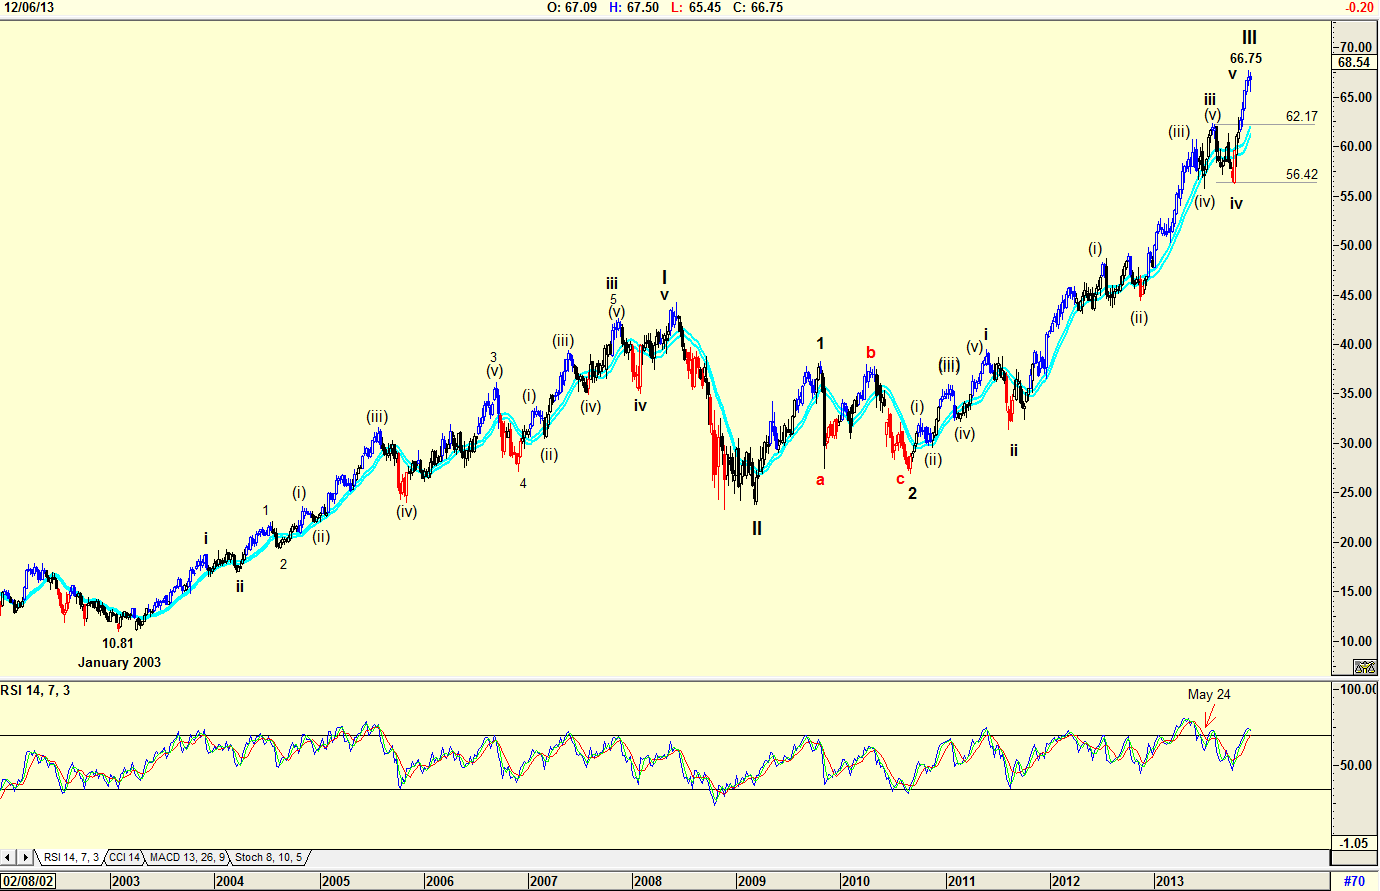
| Figure 1. Weekly chart with Elliott Wave count. |
| Graphic provided by: AdvancedGET. |
| |
| My chart in Figure 1 is a weekly chart showing how the price of the share rose from a low of $10.81 in January 2003 to its present price of $66.75. An Elliott Wave count suggests that the share price could be forming a WAVE III top at $66.75. Should this be correct, then the share price will fall to the 4th wave of lesser degree, somewhere between $56.42 and $62.17. The RSI gave a sell signal on May 24th and the share price did fall, but quickly rose to its high of $66.75. The RSI is once again at overbought levels, and the possibility of a divergence sell signal is very real. A divergence sell signal is where the share price gives a higher high while the RSI gives a lower high. |

|
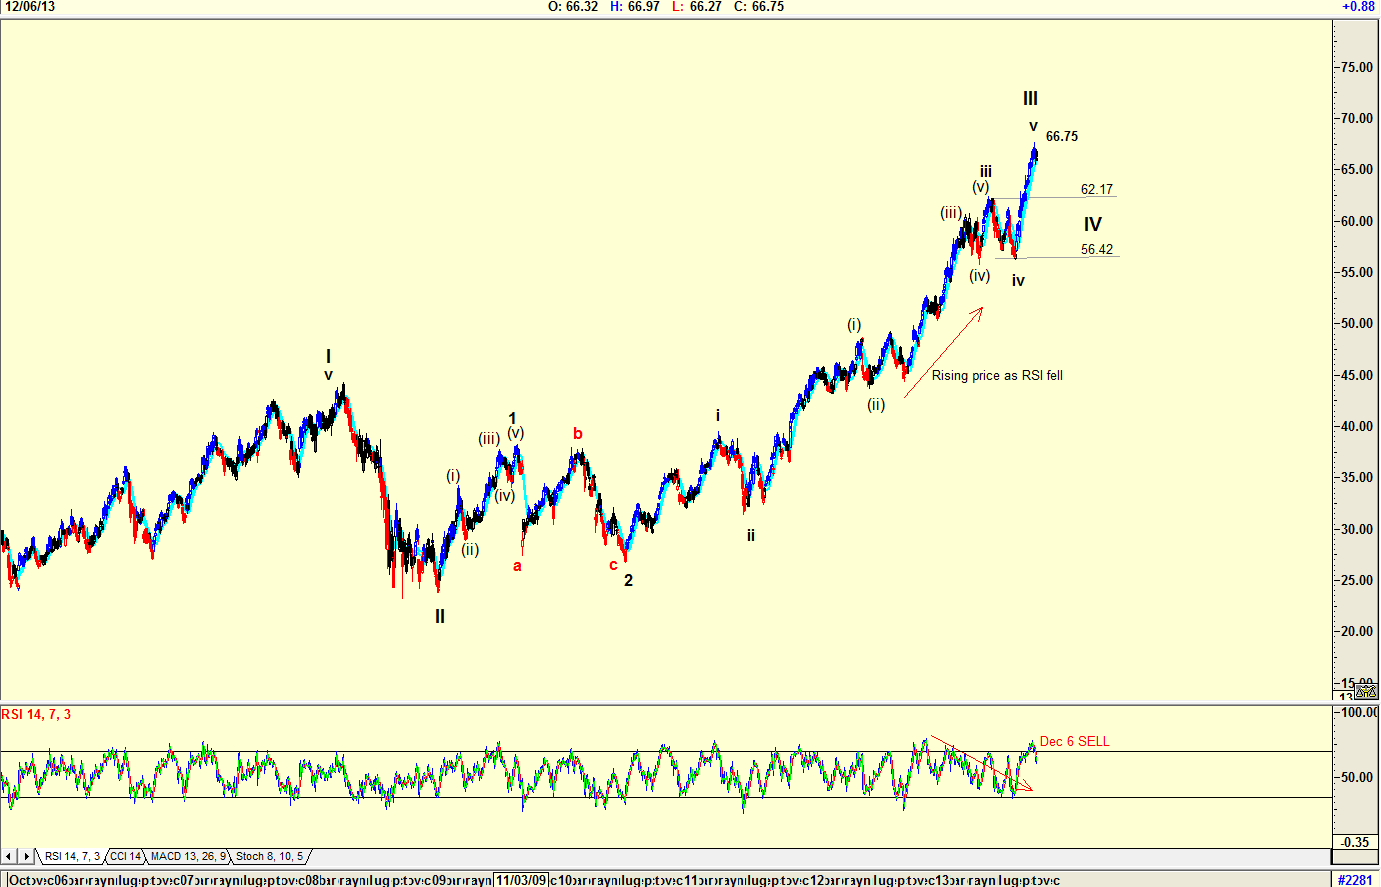
| Figure 2. Daily chart with Elliott Wave count. |
| Graphic provided by: AdvancedGET. |
| |
| A daily chart in Figure 2 confirms the weekly chart in Figure 1, namely that a WAVE IV correction is due and the share price could fall to somewhere between $62.17 and $56.42. However the RSI indicator shows that previously as the RSI fell, the share price rose. With the RSI presently at overbought levels, one wonders how effective the sell signal given on December 6th is. The upward pressure on the share price could once again distort any signal given by the RSI indicator. Note the falling volume as the price rose, a further sign of weakness ahead. |

|
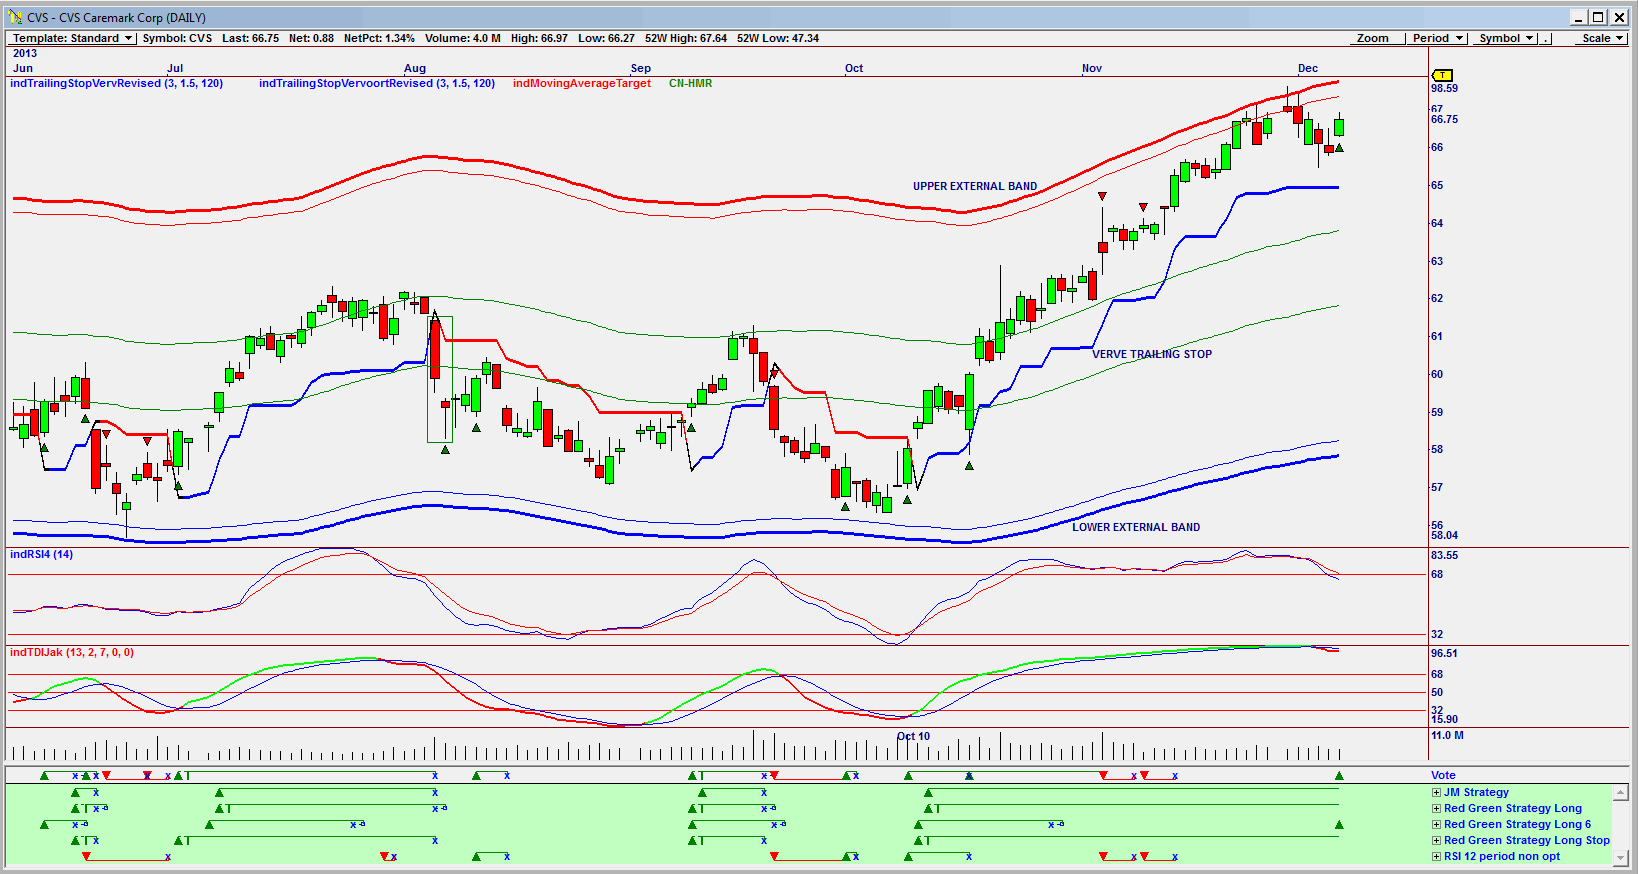
| Figure 3. Omnitrader chart with a Buy signal on the Vote line. |
| Graphic provided by: Omnitrader.. |
| |
| The chart in Figure 3 brought the share to my attention. While looking at the chart one can see the BUY signal given on the VOTE line, based on the Red Green strategy Long 6. Note that the JM Strategy, Red Green strategy long and the Red Green strategy Long Stop all gave BUY signals around October 10th. The two sell signals shown in Red were given by the RSI 12 period strategy. Because the share price is trading at the Upper External Band; because of the RSI indicator suggesting a sell signal that was given on December 6th, and despite the doubt caused by the RSI signal, I would not be a buyer of CVS Caremark Corp at present levels, even though the chart in Figure 3 has given a BUY signal. I would place the share on my watch list. This is a share I would like to own, but the price must drop to somewhere within $56.42 and $62.17. |
Has been a technical analyst since 1969, and has worked as a futures and options trader with First Financial Futures in Johannesburg, South Africa.
| Address: | 3256 West 24th Ave |
| Vancouver, BC | |
| Phone # for sales: | 6042634214 |
| E-mail address: | petroosp@gmail.com |
Click here for more information about our publications!
PRINT THIS ARTICLE

Request Information From Our Sponsors
- VectorVest, Inc.
- Executive Premier Workshop
- One-Day Options Course
- OptionsPro
- Retirement Income Workshop
- Sure-Fire Trading Systems (VectorVest, Inc.)
- Trading as a Business Workshop
- VectorVest 7 EOD
- VectorVest 7 RealTime/IntraDay
- VectorVest AutoTester
- VectorVest Educational Services
- VectorVest OnLine
- VectorVest Options Analyzer
- VectorVest ProGraphics v6.0
- VectorVest ProTrader 7
- VectorVest RealTime Derby Tool
- VectorVest Simulator
- VectorVest Variator
- VectorVest Watchdog
- StockCharts.com, Inc.
- Candle Patterns
- Candlestick Charting Explained
- Intermarket Technical Analysis
- John Murphy on Chart Analysis
- John Murphy's Chart Pattern Recognition
- John Murphy's Market Message
- MurphyExplainsMarketAnalysis-Intermarket Analysis
- MurphyExplainsMarketAnalysis-Visual Analysis
- StockCharts.com
- Technical Analysis of the Financial Markets
- The Visual Investor
