

HOT TOPICS LIST
- MACD
- Fibonacci
- RSI
- Gann
- ADXR
- Stochastics
- Volume
- Triangles
- Futures
- Cycles
- Volatility
- ZIGZAG
- MESA
- Retracement
- Aroon
INDICATORS LIST
LIST OF TOPICS
PRINT THIS ARTICLE
by Donald W. Pendergast, Jr.
Micron Technology shares are up by 330% since October 2012 but may be due for a correction soon.
Position: N/A
Donald W. Pendergast, Jr.
Freelance financial markets writer and online publisher of the Trendzetterz.com S&P 500 Weekly Forecast service.
PRINT THIS ARTICLE
LIN. REGTREND
Micron Technology: Approaching Upside Pattern Targets
12/11/13 12:47:48 PMby Donald W. Pendergast, Jr.
Micron Technology shares are up by 330% since October 2012 but may be due for a correction soon.
Position: N/A
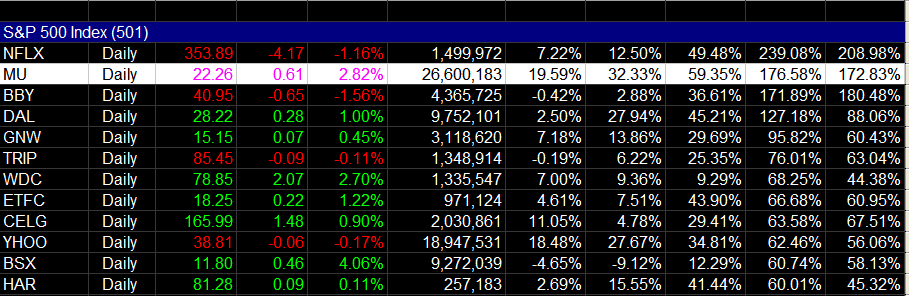
| Among all S&P 500 index (.SPX, SPY) component stocks, shares of Micron Technology (MU) would have the highest 52-week comparative relative strength vs. the index, were it not for the outsized performance gains seen in Netflix (NFLX) over the same one-year timespan. Truly, MU has been in a bull run of great import, one that still has solid fundamentals (earnings growth rates, sales growth, etc.) going for it; as such, its mighty uptrend should still be given every benefit of the doubt. Nevertheless, an interesting mix of technical dynamics are now converging, agreeing that MU's latest rally within its larger bull market may be at or close to its termination point. Here's a closer look. |
|
| Figure 1. Micron Technology (MU) has been on a major bullish tear since late October 2012; only Netflix (NFLX) has higher 52-week comparative relative strength vs. the .SPX. |
| Graphic provided by: TradeStation. |
| Graphic provided by: TradeStation RadarScreen. |
| |
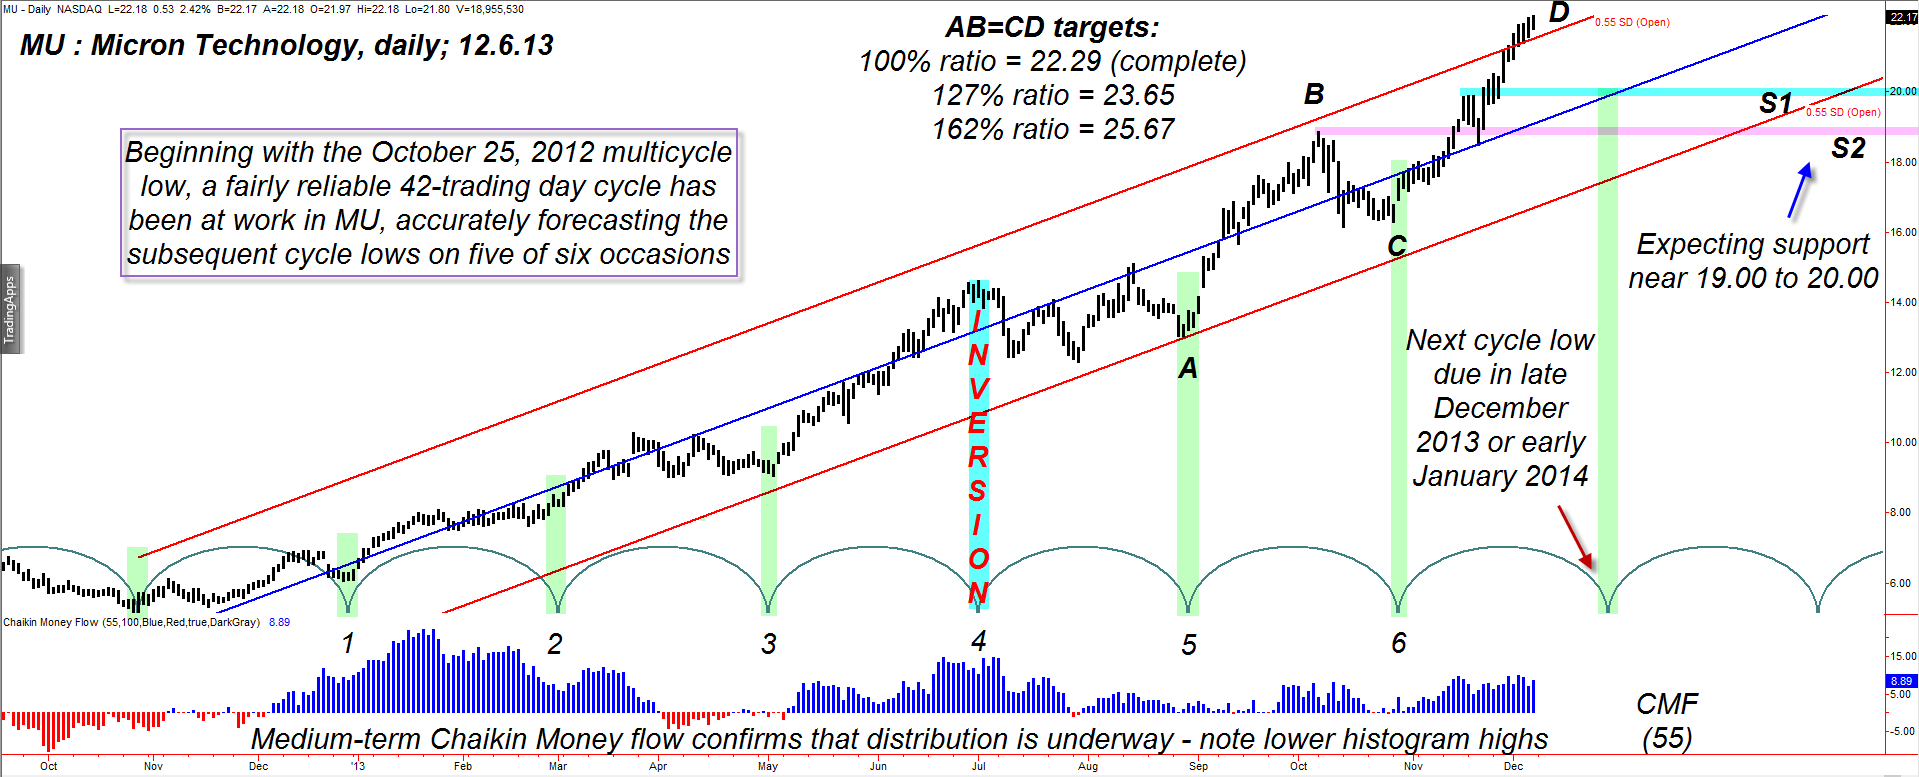
| Generally speaking, when the linear regression channel for a given stock on a particular time frame is narrow in relation to its length, you can be certain that you're looking at a stock or ETF in the midst of a low-volatility, persistent trend move. In the case of this daily chart for MU, using a linear regression channel based on standard deviations of .55 produced a usable channel reference, one that can be helpful in determining relative overbought/oversold price zones. And one of the better ways to identify oversold conditions is via the use of time cycles, as follows: 1. When the linear regression channel is trending higher, look for low-risk reversal zones to occur close to the next projected cycle low's time window. 2. If prices stay within the upwardly-sloping regression channel as the cycle low is formed and you also see that the 34-, 55- or 89-period Chaikin Money Flow (CMF) histograms (or at least two of them) are above or close to their respective zero lines, then you have added confirmation that the "smart money" is still interested in acquiring the stock in anticipation of more gains. 3. If the stock or ETF is also outperforming the .SPX over the past 13-, 26- or 52-week period at the same time that conditions one and two are met, then you also have another important trading edge working in favor of such a long entry. There may be other rules you could use to identify attractive long swing trading candidates, but the three just mentioned are powerful on their own merits. In the case of MU (Figure 2), note that at every 42-day cycle low (green arcs) that the 55-day CMF was always close to or above its zero line; the stock had also been outperforming the .SPX for most of the past year as well, as each cycle low was made. The 42-day trading cycle was accurate in most cases, although it did expand/contract slightly along the way; it is now projecting that MU should bottom again within +/- five trading days of December 29, 2013, FYI. Remember, this is a trading day cycle, and not a calendar day cycle, for the purposes of this article. Since there are usually 20-21 trading days per month, a 42-trading day cycle would put the next "ideal" cycle low at around December 29, 2013. |
|
| Figure 2. MU has been manifesting a fairly reliable 42-trading day cycle since its October 25, 2012 cycle bottom. Note that the stock has met a key AB=CD swing price target at a time when the money flow histogram suggests that distribution is underway. |
| Graphic provided by: TradeStation. |
| |
| Currently, MU is surging higher from its October 28, 2013 cycle low value of 16.30 and has now reached the initial price target for the AB=CD swings depicted on the daily chart — at 22.29. Notice that MU has also risen above the top of the regression channel at the same time that the AB=CD target has been hit and its 42-day cycle has only 13 more trading days to find its next low; in a bullish market the cycle highs always occur after the "halfway" point between the prior cycle low and the next forecasted cycle low date, so we will need to see signs of a bearish reversal soon if the late December 2013 cycle low is to be made in the context of a declining market for this stock. The (CMF)(55) clearly shows signs of slowing money flow momentum and this usually means the "smart money" is scaling out with each new rally, anticipating lower prices ahead for MU. The probabilities for a near-term sell-off for MU into late December 2013/early January 2014 are above average at this time, but only a break and close back below the upper channel line will confirm this to be underway. If MU decides to keep on truckin' higher, the next set of price targets are as follows: 1. AB * 1.27 + C = 23.65 (the new 127% Fib swing CD target) 2. AB * 1.62 + C = 25.67 (the new 162% Fib swing CD target) Again, as stated in my recent articles, the major US stock indexes are all in confirmed Elliott fifth wave patterns and investor speculation and mania are at levels not seen since the dotcom craziness of 1999-2000. If you are currently long MU, be certain you have an exit or profit protection strategy in place now, just in case the bullish fervor in the US markets wanes before Christmas or New Year's Day arrives. Trade wisely until we meet here again. |
Freelance financial markets writer and online publisher of the Trendzetterz.com S&P 500 Weekly Forecast service.
| Title: | Market consultant and writer |
| Company: | Trendzetterz |
| Address: | 81 Hickory Hollow Drive |
| Crossville, TN 38555 | |
| Phone # for sales: | 904-303-4814 |
| Website: | trendzetterz.com |
| E-mail address: | support@trendzetterz.com |
Traders' Resource Links | |
| Trendzetterz has not added any product or service information to TRADERS' RESOURCE. | |
Click here for more information about our publications!
PRINT THIS ARTICLE

Request Information From Our Sponsors
- StockCharts.com, Inc.
- Candle Patterns
- Candlestick Charting Explained
- Intermarket Technical Analysis
- John Murphy on Chart Analysis
- John Murphy's Chart Pattern Recognition
- John Murphy's Market Message
- MurphyExplainsMarketAnalysis-Intermarket Analysis
- MurphyExplainsMarketAnalysis-Visual Analysis
- StockCharts.com
- Technical Analysis of the Financial Markets
- The Visual Investor
- VectorVest, Inc.
- Executive Premier Workshop
- One-Day Options Course
- OptionsPro
- Retirement Income Workshop
- Sure-Fire Trading Systems (VectorVest, Inc.)
- Trading as a Business Workshop
- VectorVest 7 EOD
- VectorVest 7 RealTime/IntraDay
- VectorVest AutoTester
- VectorVest Educational Services
- VectorVest OnLine
- VectorVest Options Analyzer
- VectorVest ProGraphics v6.0
- VectorVest ProTrader 7
- VectorVest RealTime Derby Tool
- VectorVest Simulator
- VectorVest Variator
- VectorVest Watchdog