HOT TOPICS LIST
- MACD
- Fibonacci
- RSI
- Gann
- ADXR
- Stochastics
- Volume
- Triangles
- Futures
- Cycles
- Volatility
- ZIGZAG
- MESA
- Retracement
- Aroon
INDICATORS LIST
LIST OF TOPICS
PRINT THIS ARTICLE
by Kevin Hopson
The AMEX Oil Index, a price-weighted index of large-cap integrated oil companies, failed to follow through last week. The culprit is broken support, which is now acting as short-term resistance for the Index.
Position: Hold
Kevin Hopson
Kevin has been a technical analyst for roughly 10 years now. Previously, Kevin owned his own business and acted as a registered investment advisor, specializing in energy. He was also a freelance oil analyst for Orient Trading Co., a commodity futures trading firm in Japan. Kevin is currently a freelance writer.
PRINT THIS ARTICLE
TECHNICAL ANALYSIS
AMEX Oil Index Failed to Follow Through
10/02/02 06:27:52 PMby Kevin Hopson
The AMEX Oil Index, a price-weighted index of large-cap integrated oil companies, failed to follow through last week. The culprit is broken support, which is now acting as short-term resistance for the Index.
Position: Hold
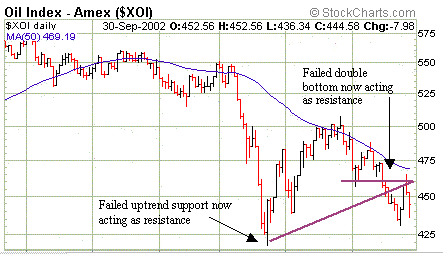
| The AMEX Oil Index (XOI) rebounded last week after hitting a new monthly low in the 430 to 435 range. However, the XOI failed to push through the 465 level, which would have been short-term "bullish" for the index. As you can see in the chart, 460 is the site of September's broken support levels (failed double bottom). It is also the site of the XOI's former uptrend line, which had provided short-term support for the Index since July's low. |
| Just to note, support levels tend to act as resistance once they are broken. The reason being that those investors who bought at a prior support level (believing it would hold) are looking to break-even once the price returns to that level. In other words, there is usually selling pressure at prior support levels. Since the XOI failed to take out the 465 level, the path of least resistance is still down. |

|
| Figure 1: Daily chart for the Amex Oil Index. |
| Graphic provided by: StockCharts.com. |
| |
| Furthermore, even if prices do turn up, resistance around the 465 level could prove more difficult the second time around. The reason being that the index's 50-day moving average - which has capped prices the last several months - is converging just below the 470 level. If the XOI can close above its declining 50-day moving average, the Index could be poised for further gains. |
| However, it looks as though the Index is setting up to test a double bottom - 430 to 435 range - in the near-term. If this area of support is taken out, a further test of July's low in the 415 to 420 range is likely. As a result, look for additional selling pressure if the XOI touches the 430 and/or 415 levels on an intraday basis. |
Kevin has been a technical analyst for roughly 10 years now. Previously, Kevin owned his own business and acted as a registered investment advisor, specializing in energy. He was also a freelance oil analyst for Orient Trading Co., a commodity futures trading firm in Japan. Kevin is currently a freelance writer.
| Glen Allen, VA | |
| E-mail address: | hopson_1@yahoo.com |
Click here for more information about our publications!
Comments
Date: 10/03/02Rank: 5Comment:
Date: 10/23/02Rank: 5Comment: the explanation of support/resistance was priceless. Very clearly defined.

Request Information From Our Sponsors
- StockCharts.com, Inc.
- Candle Patterns
- Candlestick Charting Explained
- Intermarket Technical Analysis
- John Murphy on Chart Analysis
- John Murphy's Chart Pattern Recognition
- John Murphy's Market Message
- MurphyExplainsMarketAnalysis-Intermarket Analysis
- MurphyExplainsMarketAnalysis-Visual Analysis
- StockCharts.com
- Technical Analysis of the Financial Markets
- The Visual Investor
- VectorVest, Inc.
- Executive Premier Workshop
- One-Day Options Course
- OptionsPro
- Retirement Income Workshop
- Sure-Fire Trading Systems (VectorVest, Inc.)
- Trading as a Business Workshop
- VectorVest 7 EOD
- VectorVest 7 RealTime/IntraDay
- VectorVest AutoTester
- VectorVest Educational Services
- VectorVest OnLine
- VectorVest Options Analyzer
- VectorVest ProGraphics v6.0
- VectorVest ProTrader 7
- VectorVest RealTime Derby Tool
- VectorVest Simulator
- VectorVest Variator
- VectorVest Watchdog
