

HOT TOPICS LIST
- MACD
- Fibonacci
- RSI
- Gann
- ADXR
- Stochastics
- Volume
- Triangles
- Futures
- Cycles
- Volatility
- ZIGZAG
- MESA
- Retracement
- Aroon
INDICATORS LIST
LIST OF TOPICS
PRINT THIS ARTICLE
by Billy Williams
Krispy Kreme Donuts is getting dunked, and not in a good way, so be prepared to go short or get left behind.
Position: Sell
Billy Williams
Billy Williams has been trading the markets for 27 years, specializing in momentum trading with stocks and options.
PRINT THIS ARTICLE
STOCKS
KKD Gets Dunked
12/09/13 03:55:46 PMby Billy Williams
Krispy Kreme Donuts is getting dunked, and not in a good way, so be prepared to go short or get left behind.
Position: Sell
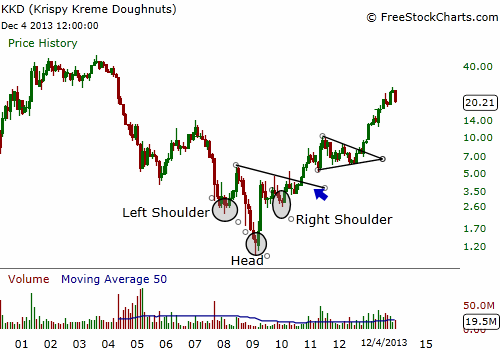
| Krispy Kreme Donuts (KKD) captured the attention of the nation's taste buds as it went public during the dotcom era, attracting legions of fans and investors. Consumers couldn't get enough of the deep-fried treats and neither could potential franchisees who stormed KKD's corporate office seeking franchises, many of whom were abandoning McDonald's and other franchise-based companies to join KKD's list of growing stores. But, the sugar-high wore off three years later and KKD began to sink, almost slipping into insolvency. Is history about to repeat itself? On August 29, 2003, KKD's stock peaked at $49.74 and then began the race downward as the bulls gave up the ghost and ran in droves from the stock while the bears were happily waiting to take control. The stock bottomed on October 31, 2005 before staging a short-lived rally going into the end of 2005 before rolling over and resuming the downward slide to lower price levels. KKD set another price low on January 31, 2008 where another short-term rally failed to reverse the trend's downward slide and the stock rolled over again, setting another lower high and lower low in KKD's price action. This stair step motion during the decline is indicative of a bearish trend when combined with higher levels of selling volume. It was during this rally that the first phase of the formation of an inverted head & shoulders pattern began to take shape and the left shoulder of the pattern formed. |
|
| Figure 1. KKD was flying high after its IPO and investors and consumers couldn't get enough of its deep-fried treats. But, the company ran into hard times, fell apart, and then formed an inverse head & shoulders pattern, signalling a reversal in the making. |
| Graphic provided by: www.freestockcharts.com. |
| |
| Again, KKD's price action resumed the downward trend but this time it traded lower on less volume, which indicated that the bears were exhausting themselves. Adding to that, KKD hit $1 status on February 27, 2009, a low point for the stock from its previous all-time high of $49.74. At this low point, however, the head portion of the inverted head & shoulder pattern formed. At this point, the public had written off KKD and looked at its product as a commodity-type business that couldn't compete with the low-cost stores of Dunkin Donuts which offered a wider selection of donuts, food types, and selection of coffees. This extreme negative sentiment served as another indicator that the stock was ready to bounce back. Why? Because crowds are often wrong in trading the stock market and amateurs tend to form opinions and make decisions around a herd mentality so it often pays to be a contrarian and look for opportunity where others see none. Soon after, the stock rallied off its price low and formed a higher high and a higher low indicating that control of the stock's trend had shifted from the bears to the bulls. Later, in September of 2010, the stock broke out above the downward trendline from the pattern's neckline confirming that the stock was now in bullish territory and set to go higher. |
|
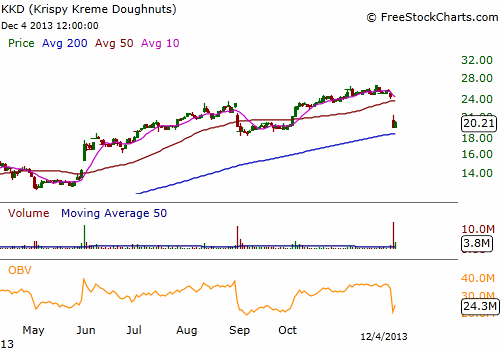
| Figure 2. The stock was trending higher from November 2, 2012 when it exploded higher out of a monthly triangle pattern but history is repeating itself with another bust in the making. The gap down on huge volume signals the stock's run is probably over and it's time to short the stock again. |
| Graphic provided by: www.freestockcharts.com. |
| |
| With the stock price still below $10, it wasn't a good time to enter into KKD but price briefly flirted with the $10 level in June 2011 before pulling back and consolidating in a tight trading range, forming a triangle pattern. KKD emerged out of the triangle pattern in late 2012, exploding higher on November 20, 2012 on a price gap accompanied by volume at almost 1,000% of its 50-day daily average. If you were aggressive, you could've entered at that point but, if you were conservative, you could have entered as the stock traded up to the $10 level and entered on a pullback or as the stock reached a new price high. News of a management turnaround, which included increasing KKD's net income to almost 800% of its previous numbers, helped turn public sentiment positive but that would soon change. |
| After experiencing almost a 150% gain since KKD broke free of the monthly triangle pattern, on December 3, 2013, the stock cratered and gapped downward on a huge spike in volume. Rumors abound but they aren't important right now. What is important is to get out now and prepare for the stock to trade lower. The stock's price action has closed below the previous low, a bearish sign, and what's needed now is to observe if the stock rebounds and then prepare to short the stock. It's rare for a stock to receive this much technical damage and recover in the short-term. Usually, this is the first step in a long series of downward declines so it pays to prepare to take advantage of that opportunity just in case. Watch for price to bounce higher and then short KKD if it trades lower using either stocks or put options, but never risking any more than 7% from your entry price. |
Billy Williams has been trading the markets for 27 years, specializing in momentum trading with stocks and options.
| Company: | StockOptionSystem.com |
| E-mail address: | stockoptionsystem.com@gmail.com |
Traders' Resource Links | |
| StockOptionSystem.com has not added any product or service information to TRADERS' RESOURCE. | |
Click here for more information about our publications!
PRINT THIS ARTICLE

Request Information From Our Sponsors
- StockCharts.com, Inc.
- Candle Patterns
- Candlestick Charting Explained
- Intermarket Technical Analysis
- John Murphy on Chart Analysis
- John Murphy's Chart Pattern Recognition
- John Murphy's Market Message
- MurphyExplainsMarketAnalysis-Intermarket Analysis
- MurphyExplainsMarketAnalysis-Visual Analysis
- StockCharts.com
- Technical Analysis of the Financial Markets
- The Visual Investor
- VectorVest, Inc.
- Executive Premier Workshop
- One-Day Options Course
- OptionsPro
- Retirement Income Workshop
- Sure-Fire Trading Systems (VectorVest, Inc.)
- Trading as a Business Workshop
- VectorVest 7 EOD
- VectorVest 7 RealTime/IntraDay
- VectorVest AutoTester
- VectorVest Educational Services
- VectorVest OnLine
- VectorVest Options Analyzer
- VectorVest ProGraphics v6.0
- VectorVest ProTrader 7
- VectorVest RealTime Derby Tool
- VectorVest Simulator
- VectorVest Variator
- VectorVest Watchdog